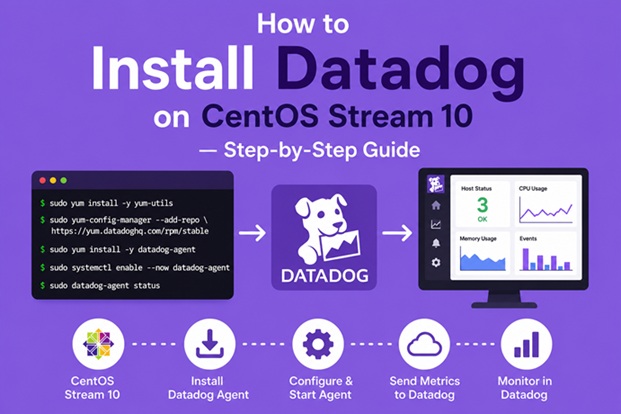
How to Install Datadog on CentOS Stream 10 — Step-by-Step Guide
Introduction
Datadog is one of the most powerful cloud-scale observability and monitoring platforms used by DevOps, SRE, and platform engineering teams worldwide. It provides end-to-end visibility into infrastructure, applications, logs, and network performance — all from a single unified dashboard.
In this guide, you will learn how to install and configure the Datadog Agent on CentOS Stream 10 from scratch, including:
- Two installation methods (manual repository setup and one-line script)
- How to configure log collection and process monitoring
- How to verify the agent is reporting correctly
- SELinux and firewall configuration
- Common troubleshooting steps
- Next steps for deeper monitoring
Whether you’re a sysadmin, DevOps engineer, or IT operations professional, this guide walks you through every step so you can get Datadog running reliably on CentOS Stream 10.
Related reading: Datadog: The Complete Guide to Modern Monitoring and Observability (2025 Edition)
What Is the Datadog Agent?
The Datadog Agent is a lightweight software process that runs on your server and collects metrics, events, logs, and traces — then forwards them to Datadog’s cloud platform. It is the core component that enables monitoring.
The Agent collects data from:
- System-level resources — CPU, RAM, disk I/O, network throughput
- Running processes — resource usage per process
- Logs — syslog, application logs, custom log files
- Custom integrations — MySQL, NGINX, PostgreSQL, Redis, Docker, and 800+ other technologies
The Agent runs as a background service (datadog-agent) and communicates securely over HTTPS (port 443) to Datadog’s backend.
Prerequisites
Before starting, make sure you have the following ready:
| Requirement | CentOS Stream 10 (x86_64) |
| Operating System | sudo or root access |
| User privileges | Required to download packages |
| Internet access | Required to download packages |
| Datadog account | Sign up free at datadoghq.com |
| Datadog API Key | Found in Organization Settings → API Keys |
| Firewall | Outbound HTTPS (port 443) must be allowed |
| Disk space | At least 500 MB free |
How to Get Your Datadog API Key
- Log in to app.datadoghq.com
- Navigate to Organization Settings → API Keys
- Click New Key or copy an existing one
- Keep this key ready — you will need it in Step 4
Method 1: Manual Installation via Yum Repository (Recommended)
This method gives you full control over the installation and is ideal for production environments.
Step 1 — Update System Packages
Start by updating your system to ensure compatibility with the latest agent packages and security patches:
sudo dnf update -yThis may take a few minutes depending on the number of pending updates.
Step 2 — Install Required Dependencies
Ensure that curl and gnupg are installed, as they are needed to verify the Datadog GPG key:
sudo dnf install -y curl gnupgStep 3 — Add the Datadog Yum Repository
Create the Datadog repository file so that dnf/yum can locate the agent packages:
sudo tee /etc/yum.repos.d/datadog.repo <<EOF[datadog]
name=Datadog, Inc. baseurl=https://yum.datadoghq.com/stable/7/x86_64/ enabled=1 gpgcheck=1 repo_gpgcheck=1 gpgkey=https://keys.datadoghq.com/DATADOG_RPM_KEY_CURRENT.public https://keys.datadoghq.com/DATADOG_RPM_KEY_B01082D3.public EOF
Note: Two GPG keys are included for redundancy and forward compatibility. The
repo_gpgcheck=1flag validates the repository metadata itself, adding an extra layer of security.
Step 4 — Install the Datadog Agent
Refresh the package metadata and install the agent:
sudo dnf makecache
sudo dnf install -y datadog-agent
The agent will be installed along with all required dependencies. The binary will be placed at /usr/bin/datadog-agent.
Step 5 — Configure the Datadog Agent
The main configuration file is located at:
/etc/datadog-agent/datadog.yamlCopy the example configuration file to create your working config:
sudo cp /etc/datadog-agent/datadog.yaml.example /etc/datadog-agent/datadog.yamlNow edit the configuration file:
sudo nano /etc/datadog-agent/datadog.yamlLocate and update the following fields:
## API Key — required
api_key: YOUR_DATADOG_API_KEY

## Datadog site — change based on your account region
## US:  datadoghq.com (default)
## EU:  datadoghq.eu
## US3: us3.datadoghq.com
## US5: us5.datadoghq.com
site: datadoghq.com

## Optional: assign a custom hostname (useful in multi-server environments)
# hostname: my-centos-server

## Optional: add tags to filter/group hosts in Datadog
# tags:
#   - env:production
#   - role:webserver
#   - team:devops
Save the file and exit (Ctrl+X, Y, Enter in nano).
Step 6 — Enable Log Collection (Optional but Recommended)
By default, log collection is disabled. To enable it, open datadog.yaml and set:
logs_enabled: trueThen create a log configuration for a service. For example, to collect syslog:
sudo mkdir -p /etc/datadog-agent/conf.d/syslog.d/
sudo tee /etc/datadog-agent/conf.d/syslog.d/conf.yaml <<EOF
logs:
  - type: file
    path: /var/log/messages
    service: syslog
    source: centos
    tags:
      - env:production
EOF
Make sure the dd-agent user has read access to the log file:
sudo usermod -aG adm dd-agentStep 7 — Enable Process Monitoring (Optional)
To monitor running processes, enable the process agent in datadog.yaml:
process_config:
  process_collection:
    enabled: true
Step 8 — Configure Firewall (If Active)
If firewalld is running, allow outbound HTTPS traffic:
sudo firewall-cmd --permanent --add-service=https
sudo firewall-cmd --reload
Verify that port 443 is open:
curl -I https://api.datadoghq.comYou should receive a 200 OK or redirect response, confirming connectivity.
Step 9 — Configure SELinux (If Enforcing)
On CentOS Stream 10 with SELinux enabled (enforcing mode), the Datadog Agent may need additional policies. Check the current SELinux mode:
getenforceIf the output is Enforcing, run the following to allow the agent to collect system metrics:
sudo semanage permissive -a datadog_agent_tAlternatively, if you are using a policy module from Datadog’s GitHub repository, you can install a custom SELinux policy. Refer to Datadog’s SELinux documentation for the latest module.
Step 10 — Start and Enable the Datadog Agent
Start the agent and ensure it starts automatically on boot:
sudo systemctl enable datadog-agent
sudo systemctl start datadog-agent
Check the service status to confirm it is running:
sudo systemctl status datadog-agentExpected output:
● datadog-agent.service - Datadog Agent
     Loaded: loaded (/lib/systemd/system/datadog-agent.service; enabled)
     Active: active (running) since ...
Step 11 — Verify the Agent Is Reporting
Run the agent’s built-in status command:
sudo datadog-agent statusThis output includes:
- Agent version and uptime
- API key validation status
- Hostname being reported
- Enabled integrations and their status
- Metric collection details
- Log collection status (if enabled)
Within 5–10 minutes, your CentOS Stream 10 host should appear under Infrastructure → Host Map in the Datadog console.
Method 2: One-Line Script Installation
Datadog provides an automated install script that handles repository setup, package installation, and initial configuration in a single command. This is faster for testing or non-production setups.
DD_API_KEY=<YOUR_DATADOG_API_KEY> \
DD_SITE="datadoghq.com" \
bash -c "$(curl -L https://install.datadoghq.com/scripts/install_script_agent7.sh)"
Optional environment variables you can add:
| Variable | Purpose |
DD_HOSTNAME | Custom hostname for this host |
DD_TAGS | Comma-separated tags, e.g. env:prod,role:web |
DD_AGENT_MAJOR_VERSION=7 | Force Agent v7 |
DD_LOGS_ENABLED=true | Enable log collection |
Example with additional options:
DD_API_KEY=<YOUR_API_KEY> \
DD_SITE="datadoghq.com" \
DD_HOSTNAME="my-centos-server" \
DD_TAGS="env:production,team:ops" \
DD_LOGS_ENABLED=true \
bash -c "$(curl -L https://install.datadoghq.com/scripts/install_script_agent7.sh)"
Limitation: The one-line script gives less control than manual installation. For production environments, the manual method is preferred.
Verifying in the Datadog Dashboard
After the agent starts reporting, verify it from the Datadog web UI:
- Go to app.datadoghq.com
- Navigate to Infrastructure → Host Map
- Find your server by hostname or IP
- Click on the host to see live metrics: CPU, memory, disk, network
- Check Logs → Live Tail if log collection was enabled
Useful Agent Commands
| Command | Purpose |
sudo datadog-agent status | Full agent status and diagnostics |
sudo datadog-agent health | Quick health check |
sudo datadog-agent configcheck | Validate all configuration files |
sudo datadog-agent flare | Generate a debug bundle to send to Datadog support |
sudo systemctl restart datadog-agent | Restart the agent |
sudo systemctl stop datadog-agent | Stop the agent |
sudo datadog-agent version | Show the installed agent version |
Troubleshooting
Agent Not Appearing in Datadog Dashboard
- Verify the API key is correct — no extra spaces or characters
- Confirm the
sitevalue matches your account region - Check that outbound HTTPS (port 443) is not blocked
- Run
sudo datadog-agent statusand look for connection errors - Check agent logs:
sudo journalctl -u datadog-agent -n 100
Permission Denied on Log Files
- Ensure the
dd-agentuser belongs to the correct group:
  sudo usermod -aG adm dd-agent
  sudo systemctl restart datadog-agent
SELinux Blocking the Agent
- Check for AVC denials:
sudo ausearch -m avc -ts recent- Set the agent domain to permissive temporarily:
sudo semanage permissive -a datadog_agent_tPackage Installation Fails
- Verify internet connectivity to
yum.datadoghq.com - Try importing the GPG key manually:
sudo rpm --import https://keys.datadoghq.com/DATADOG_RPM_KEY_CURRENT.publicNext Steps: Expanding Your Monitoring
Once the base agent is running, consider these enhancements:
Enable Integrations
The Datadog Agent supports 800+ integrations. Enable them in /etc/datadog-agent/conf.d/. For example, to monitor NGINX:
sudo cp /etc/datadog-agent/conf.d/nginx.d/conf.yaml.example \
        /etc/datadog-agent/conf.d/nginx.d/conf.yaml
Edit the config and restart the agent.
Enable APM (Application Performance Monitoring)
Enable tracing in datadog.yaml:
apm_config:
  enabled: true
Then instrument your application with a Datadog tracing library (Python, Java, Go, Node.js, etc.).
Enable Network Performance Monitoring
network_config:
  enabled: true
Enable Container Monitoring (if using Docker)
sudo usermod -aG docker dd-agentThen enable the Docker integration in /etc/datadog-agent/conf.d/docker.d/conf.yaml.
Summary
In this guide, you’ve learned how to:
- ✅ Add the Datadog yum repository to CentOS Stream 10
- ✅ Install the Datadog Agent using
dnf - ✅ Configure the agent with your API key, site, hostname, and tags
- ✅ Enable log collection and process monitoring
- ✅ Configure the firewall and SELinux for the agent
- ✅ Start, enable, and verify the agent service
- ✅ Use the one-line script as an alternative method
- ✅ Troubleshoot common installation issues
- ✅ Expand monitoring with integrations, APM, and containers
Datadog on CentOS Stream 10 gives your team real-time visibility into infrastructure health, enabling faster incident detection, proactive capacity planning, and better overall system reliability.
Related posts:
 How to Install Monitorix on CentOS Stream 10 (Step-by-Step Guide)
 Getting Started with ManageEngine, Powerful Monitoring Tools