How To Install Nagios On Ubuntu 26.04 LTS (Step-by-Step Guide 2026)

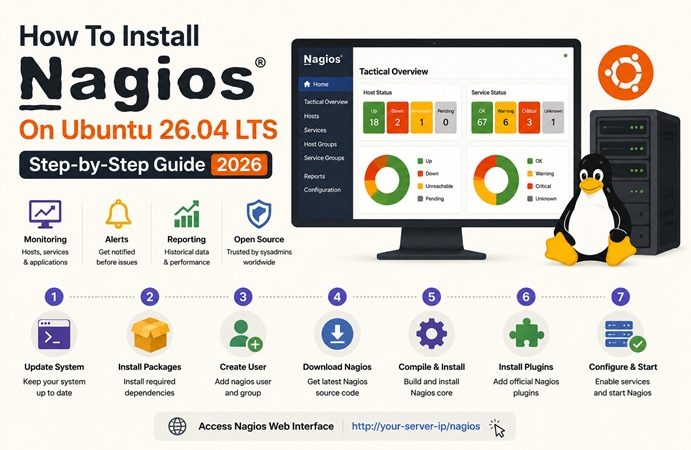
Table of Contents
- Introduction
- Why Nagios Still Matters in 2026
- APT vs Source Install: Which Should You Choose?
- Architecture Overview
- Prerequisites
- Step 1: Update the System and Install Dependencies
- Step 2: Create the Nagios User and Group
- Step 3: Download and Compile Nagios Core
- Step 4: Install Nagios Plugins
- Step 5: Configure the Web Interface
- Step 6: Start and Enable Nagios
- Step 7: Verify Your First Host Check
- Step 8: Add a Remote Host to Monitor
- Securing Your Nagios Installation
- Troubleshooting Common Issues
- Nagios vs Prometheus vs Zabbix
- Conclusion
- FAQ
Introduction
Nagios has been the go-to answer to one deceptively simple question for over two decades: is this service up or down, right now? While newer observability stacks chase dashboards and metrics, Nagios still does host and service alerting better than almost anything else — which is exactly why it remains in active production use in 2026.
This guide walks through a clean installation of Nagios Core 4.5.13 on Ubuntu 26.04 LTS, compiled from source so you get the latest stable release rather than the older APT package. By the end, you’ll have a working Nagios web interface, a monitored localhost, and a template ready to add remote servers.
Estimated reading time: 11 minutes
Why Nagios Still Matters in 2026
Before jumping into commands, it’s worth understanding where Nagios fits in a modern monitoring stack:
- Mature plugin ecosystem — thousands of community plugins for nearly any service, protocol, or hardware
- Low resource footprint — runs comfortably on a small VPS, unlike heavier metrics stacks
- Deterministic alerting — clear OK/WARNING/CRITICAL/UNKNOWN states with flexible notification escalation
- Battle-tested reliability — 26+ years of production use across enterprises and small teams alike
Nagios isn’t a replacement for time-series metrics platforms — it’s a complement. Many teams pair it with Prometheus and Grafana: Nagios handles the “is it alive” alerting, while Prometheus/Grafana handle trend analysis and dashboards. If you’ve already set up Prometheus and Grafana on Docker for metrics, adding Nagios gives you a dedicated alerting layer on top.
APT vs Source Install: Which Should You Choose?
Ubuntu 26.04’s default repositories ship an older Nagios build. Here’s how the two installation paths compare:
| Criteria | APT (apt install nagios4) | Source Compile (this guide) |
|---|---|---|
| Version installed | Nagios Core 4.4.6 | Nagios Core 4.5.13 (latest) |
| Install time | ~5 minutes | ~15–20 minutes |
| Feature freshness | Frozen at Ubuntu release | Latest upstream features |
| Performance improvements | None | Yes — faster check scheduling, improved logging |
| Update path | apt upgrade (slow cadence) | Manual recompile (full control) |
| Best for | Quick testing, labs | Production monitoring servers |
If you just want to kick the tires, sudo apt install nagios4 gets you running in five minutes. This guide focuses on the source install, since it’s the method production environments should use to get current performance and security fixes.
Architecture Overview
                         ┌─────────────────────────────┐
                         │        Ubuntu 26.04 LTS     │
                         │                             │
   Browser  ──HTTP/HTTPS──▶  Apache 2.4 (mod_php)      │
  (Admin PC)             │        │                    │
                         │        ▼                    │
                         │   Nagios Web CGI/PHP UI     │
                         │        │                    │
                         │        ▼                    │
                         │   Nagios Core 4.5.13 daemon │
                         │   /usr/local/nagios/        │
                         │        │                    │
                         │        ▼                    │
                         │   Nagios Plugins (check_*)  │
                         └────────┼────────────────────┘
                                  │
                    ┌─────────────┼─────────────┐
                    ▼             ▼             ▼
              check_ping     check_http    NRPE / SSH
              (local host)  (local host)  (remote hosts)
                                  │
                                  ▼
                         ┌─────────────────┐
                         │  Remote Servers │
                         │  (NRPE agent)   │
                         └─────────────────┘
Nagios Core itself is just a scheduling and alerting engine — the actual checks are delegated to small plugin binaries (check_ping, check_http, check_disk, etc.), and remote hosts are typically monitored via NRPE (Nagios Remote Plugin Executor) or SSH.
Prerequisites
- A server running Ubuntu 26.04 LTS with a non-root sudo user
- At least 1 GB RAM and 1 vCPU (2 GB recommended if monitoring 50+ hosts)
- Basic firewall configured (UFW or equivalent) with port 80/443 reachable
- A domain or static IP if you plan to access the web UI remotely
Step 1: Update the System and Install Dependencies
sudo apt update && sudo apt upgrade -y

sudo apt install -y \
  build-essential gcc make unzip \
  libgd-dev libssl-dev \
  apache2 php libapache2-mod-php php-gd \
  openssl wget curl autoconf gettext
This pulls in the compiler toolchain, libgd (required for Nagios’s status map graphics), Apache with PHP for the web interface, and the utilities needed to fetch and extract the source tarball.
Step 2: Create the Nagios User and Group
Nagios runs as a dedicated unprivileged user. Web-triggered commands (like acknowledging alerts from the browser) go through a shared group called nagcmd.
sudo useradd -m -s /bin/bash nagios
sudo passwd nagios

sudo groupadd nagcmd
sudo usermod -aG nagcmd nagios
sudo usermod -aG nagcmd www-data
Step 3: Download and Compile Nagios Core
cd /tmp
wget https://assets.nagios.com/downloads/nagioscore/releases/nagios-4.5.13.tar.gz
tar -xzf nagios-4.5.13.tar.gz
cd nagios-4.5.13

./configure --with-httpd-conf=/etc/apache2/sites-enabled --with-command-group=nagcmd

make all
sudo make install
sudo make install-init
sudo make install-commandmode
sudo make install-config
sudo make install-webconf
Tip: Always check nagios.org/downloads for the current release number before running
wget— version numbers change as new releases ship.
Enable the Apache modules Nagios needs and reload:
sudo a2enmod rewrite cgi
sudo systemctl restart apache2
Step 4: Install Nagios Plugins
The core daemon is useless without plugins — this is what actually performs each check.
cd /tmp
wget https://nagios-plugins.org/download/nagios-plugins-2.5.0.tar.gz
tar -xzf nagios-plugins-2.5.0.tar.gz
cd nagios-plugins-2.5.0

./configure --with-nagios-user=nagios --with-nagios-group=nagios
make
sudo make install
This installs dozens of check_* binaries into /usr/local/nagios/libexec/ — check_ping, check_http, check_disk, check_load, check_ssh, and more.
Step 5: Configure the Web Interface
Create the admin account used to log in to the web UI:
sudo htpasswd -c /usr/local/nagios/etc/htpasswd.users nagiosadminYou’ll be prompted to set a password — use a strong one, since this account has control over alert acknowledgment and configuration reload.
Restart Apache to apply the new auth configuration:
sudo systemctl restart apache2Step 6: Start and Enable Nagios
Before starting, validate the configuration — this catches typos before they cause a silent failure:
sudo /usr/local/nagios/bin/nagios -v /usr/local/nagios/etc/nagios.cfgIf the output ends with “Things look okay”, you’re ready to start the service:
sudo systemctl start nagios
sudo systemctl enable nagios
sudo systemctl status nagios --no-pager
Expected output:
● nagios.service - Nagios Core 4.5.13
   Loaded: loaded (/usr/lib/systemd/system/nagios.service; enabled)
   Active: active (running)
   Main PID: 29018 (nagios)
   Tasks: 5
   Memory: 5.1M
Step 7: Verify Your First Host Check
Open your browser and navigate to:
http://your-server-ip/nagios/Log in with nagiosadmin and the password set in Step 5. Click Hosts in the left sidebar — you should see localhost reporting as UP, with default checks (PING, current load, disk space, SSH) already running under Services.
Step 8: Add a Remote Host to Monitor
Out of the box, Nagios only monitors localhost. To monitor a remote server, define it in a new config file:
sudo nano /usr/local/nagios/etc/objects/remote-servers.cfgdefine host {
use linux-server
host_name web-server-01
alias Production Web Server
address 10.0.1.50
max_check_attempts 5
check_period 24x7
notification_interval 30
notification_period 24x7
}
define service {
use generic-service
host_name web-server-01
service_description PING
check_command check_ping!100.0,20%!500.0,60%
}
define service {
use generic-service
host_name web-server-01
service_description HTTP
check_command check_http
}Register the new file in nagios.cfg:
sudo nano /usr/local/nagios/etc/nagios.cfgcfg_file=/usr/local/nagios/etc/objects/remote-servers.cfgValidate and reload:
sudo /usr/local/nagios/bin/nagios -v /usr/local/nagios/etc/nagios.cfg
sudo systemctl reload nagios
For checks beyond basic ping/HTTP (like remote disk space or process counts), install the NRPE agent on the target host — that’s a topic worth its own dedicated guide.
Securing Your Nagios Installation
| Practice | Why It Matters |
|---|---|
Change the default nagiosadmin password immediately | Default/weak credentials are the #1 attack vector on exposed dashboards |
Restrict /nagios/ access via firewall or VPN | The web UI shouldn’t be reachable from the public internet |
| Enable HTTPS with a reverse proxy (Nginx/Apache + Let’s Encrypt) | HTTP Basic Auth sends credentials in the clear otherwise |
Run nagios -v before every config reload | Catches syntax errors before they silently break monitoring |
Limit nagcmd group membership | Only accounts that need to trigger commands from the UI should be in this group |
If you already run a reverse proxy for other services, see how to set up Nginx Proxy Manager to put Nagios behind SSL alongside your other internal tools.
Troubleshooting Common Issues
| Symptom | Likely Cause | Fix |
|---|---|---|
| Web UI shows blank page or 403 error | Apache config not linked correctly | Re-run sudo make install-webconf, then sudo systemctl restart apache2 |
| “Things look okay” not shown during config check | Syntax error in .cfg file | Read the exact line number in the error output and fix the object definition |
| Login prompt loops after entering correct password | .htpasswd file not readable by Apache | sudo chmod 644 /usr/local/nagios/etc/htpasswd.users |
| Host shows PENDING indefinitely | nagios service not actually running | sudo systemctl status nagios, check /usr/local/nagios/var/nagios.log |
check_http always returns UNKNOWN | Plugin not compiled with SSL support | Reinstall plugins with libssl-dev present before compiling |
| Remote host checks fail with “Connection refused” | Firewall blocking NRPE port 5666 | sudo ufw allow 5666/tcp on the remote host |
| Status map / graphs not rendering | Missing libgd at compile time | Install libgd-dev and recompile Nagios Core |
Nagios vs Prometheus vs Zabbix
A common question after getting Nagios running: do you need anything else?
| Feature | Nagios Core | Prometheus + Grafana | Zabbix |
|---|---|---|---|
| Primary strength | Up/down alerting | Metrics & time-series | Hybrid (metrics + alerting) |
| Setup complexity | Moderate (manual config files) | Moderate–High | Moderate |
| Plugin ecosystem | Massive, decades old | Exporters (growing fast) | Built-in templates |
| Best for | Availability alerting | Dashboards & trend analysis | Mid-size unified monitoring |
| Resource usage | Very light | Moderate–Heavy at scale | Moderate |
There’s no wrong answer here — many production environments run Nagios for alerting and Prometheus/Grafana for metrics dashboards side by side, each doing what it’s best at.
Conclusion
You now have a working Nagios Core 4.5.13 installation on Ubuntu 26.04 LTS, compiled from source, with the web interface secured behind HTTP authentication and your first remote host template ready to extend. From here, the natural next steps are:
- Installing NRPE on remote hosts for deeper checks (disk, memory, processes)
- Configuring notification commands (email, Slack, PagerDuty) so alerts actually reach someone
- Organizing hosts into host groups as your infrastructure grows
- Pairing Nagios with a metrics stack like Prometheus and Grafana for full-picture observability
Nagios earned its reputation the hard way — by being reliable when everything else was on fire. Get it running early, and it’ll quietly do its job for years.
FAQ
Should I install Nagios from APT or from source on Ubuntu 26.04?
APT installs Nagios 4.4.6 in minutes but lags behind on features. Compiling from source gets you Nagios Core 4.5.13 with the latest performance and API improvements, which is the method this guide covers.
What is the default Nagios web interface URL after installation?
After installation, the Nagios web interface is available at http://your-server-ip/nagios/, secured with HTTP basic authentication using the nagiosadmin account.
Is Nagios still relevant compared to Prometheus in 2026?
Yes. Nagios remains the standard for host/service up-down alerting with a mature plugin ecosystem, while Prometheus excels at metrics and time-series data. Many teams run both together.
Related posts:
 How To Install Grafana on Ubuntu 20.04 LTS
 Installing and Setting Up Nagios on CentOS Stream 9: A Practical Guide
 Quick and Easy Zabbix Installation on Ubuntu 24.04
 Installing and Configuring Elasticsearch on Ubuntu 20.04 LTS
 How to Install Elasticsearch on Ubuntu 26.04 LTS
 How To Install MySQL Database on Ubuntu 18.04 LTS
 Installing Apache Groovy On Ubuntu 20.04 LTS Step by Step
 How To Install Gradle on Ubuntu 20.04
