InfluxDB vs Prometheus vs TimescaleDB: Time Series Database Comparison

Servers, containers, IoT sensors, trading platforms and applications all produce data that arrives as a stream of timestamped values. Ordinary databases can store it, but they are not designed for the write volume, time-based queries and automatic expiry that this data needs. Time series databases (TSDBs) are.
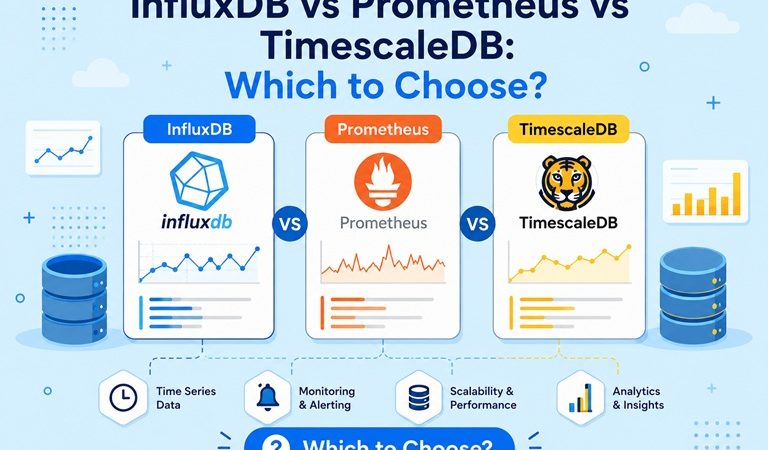
Three names come up constantly: InfluxDB, Prometheus and TimescaleDB. They overlap, but they were built with different goals. This guide compares them across data model, querying, scaling, alerting and operations, then helps you pick one.
Table of Contents
- What Is a Time Series Database?
- The Three Contenders in Brief
- Architecture: Push vs Pull vs SQL Extension
- Side-by-Side Comparison
- Query Languages Compared
- Scaling, Retention and High Availability
- Ecosystem and Integrations
- Which One Should You Choose?
- Can You Combine Them?
- Common Selection Mistakes
- FAQ
- Conclusion
1. What Is a Time Series Database?
A time series is a sequence of measurements ordered by time: CPU usage every 10 seconds, temperature every minute, orders per hour. A TSDB is optimized for this workload:
- High write throughput with mostly append-only data.
- Time-based queries such as “average over the last 24 hours, grouped per 5 minutes”.
- Compression, because neighbouring values are similar.
- Retention and downsampling, so old detail is dropped or summarized automatically.
Two ideas appear in every TSDB: the series (a unique combination of metric name and labels or tags, for example cpu{host="web01"}) and cardinality (the number of unique series). High cardinality is the most common cause of TSDB performance trouble, and each product handles it differently.
2. The Three Contenders in Brief
InfluxDB: the purpose-built TSDB
InfluxDB is a dedicated time series database from InfluxData. Clients push data to it using line protocol over HTTP. InfluxDB 2.x uses the Flux and InfluxQL languages and includes a built-in web UI, buckets and tasks. InfluxDB 3 (Core and Enterprise) is a newer engine that stores data in Apache Arrow and Parquet format and adds SQL support. It fits general time series storage well: infrastructure metrics, IoT, sensor and event data.
Prometheus: the monitoring system
Prometheus is a CNCF graduated project designed for monitoring and alerting, not general data storage. It pulls (scrapes) metrics from HTTP endpoints exposed by applications and exporters, stores them in a local time series store, and evaluates alert rules with PromQL. Together with Alertmanager it forms the standard monitoring stack in Kubernetes environments.
TimescaleDB: time series inside PostgreSQL
TimescaleDB is an extension for PostgreSQL. It turns ordinary tables into hypertables that are automatically partitioned by time, and adds compression, continuous aggregates and retention policies. Because it is still PostgreSQL, you keep full SQL, joins, transactions, indexes and the entire PostgreSQL tool ecosystem. It suits teams that want time series data next to relational data.
3. Architecture: Push vs Pull vs SQL Extension
 INFLUXDB (push)                 PROMETHEUS (pull)               TIMESCALEDB (SQL)
 ─────────────────               ─────────────────               ─────────────────
  App / Telegraf                  App / exporter                  App / ETL / Telegraf
       │                               ▲                               │
       │ HTTP write                    │ scrape /metrics               │ INSERT / COPY
       ▼                               │ every N seconds               ▼
  ┌───────────┐                   ┌────┴──────┐                  ┌──────────────┐
  │ InfluxDB  │                   │Prometheus │                  │  PostgreSQL  │
  │  buckets  │                   │ local TSDB│                  │  + Timescale │
  └─────┬─────┘                   └────┬──────┘                  │  hypertables │
        │ Flux / SQL /                 │ PromQL                  └──────┬───────┘
        │ InfluxQL                     ▼                                │ SQL
        ▼                         Alertmanager                          ▼
     Grafana                      + Grafana                          Grafana / BI /
                                                                     any SQL client
The push versus pull difference matters in practice. Pull makes it obvious when a target is down (the scrape fails), and it is easy to reason about in Kubernetes with service discovery. Push suits short-lived jobs, devices behind firewalls and any source that cannot expose an endpoint.
4. Side-by-Side Comparison
Core characteristics
| Feature | InfluxDB | Prometheus | TimescaleDB |
|---|---|---|---|
| Primary purpose | General time series storage | Monitoring and alerting | Time series on PostgreSQL |
| Data collection | Push (line protocol, Telegraf) | Pull (scrape); remote write to receive | Push via SQL, COPY, Telegraf, ETL |
| Data model | Measurements, tags, fields | Metrics with labels, float samples | Relational tables (hypertables) |
| Query language | Flux and InfluxQL (v2); SQL and InfluxQL (v3) | PromQL | SQL |
| Text and string data | Supported as fields | Not designed for it | Full PostgreSQL types |
| Joins with other data | Limited | No | Yes, native SQL joins |
| Built-in UI | Yes (v2) | Basic expression browser | No (use pgAdmin, Grafana, etc.) |
| Built-in alerting | Tasks and checks (v2) | Alert rules + Alertmanager | No (use Grafana alerting or external tools) |
| Licence | Open source core, commercial editions | Apache 2.0 | Apache 2.0 core; some features under the Timescale License |
Operations and scale
| Aspect | InfluxDB | Prometheus | TimescaleDB |
|---|---|---|---|
| Default port | 8086 (v2), 8181 (v3 Core) | 9090 | 5432 (PostgreSQL) |
| Storage | TSM (v2), Parquet on object store (v3) | Local disk TSDB | PostgreSQL storage with chunking and compression |
| Clustering | Enterprise editions | Single node by design; scale via federation or remote storage | PostgreSQL replication; multi-node options vary by version |
| Long-term storage | Native, with retention per bucket | Local retention is limited; use remote write to long-term stores | Native, with compression and tiering options |
| Cardinality tolerance | Moderate in v2; improved in v3 | Sensitive; high cardinality quickly uses memory | Handles it as ordinary rows and indexes, still needs design care |
| Operational skill | Moderate | Low for basic use, higher at scale | Requires PostgreSQL know-how |
Read “scaling” claims as rules of thumb. Real limits depend on series count, write rate, query patterns and hardware, so benchmark with your own workload.
5. Query Languages Compared
The same question, “average CPU usage per host over the last hour, in 5 minute buckets”, looks very different in each system.
PromQL (Prometheus):
avg by (instance) (
  rate(node_cpu_seconds_total{mode!="idle"}[5m])
)
Flux (InfluxDB 2.x):
from(bucket: "server_stats")
  |> range(start: -1h)
  |> filter(fn: (r) => r._measurement == "cpu" and r._field == "usage")
  |> aggregateWindow(every: 5m, fn: mean)
  |> group(columns: ["host"])
SQL (TimescaleDB, and InfluxDB 3):
SELECT time_bucket('5 minutes', time) AS bucket,
       host,
       avg(usage) AS avg_usage
FROM cpu
WHERE time > now() - interval '1 hour'
GROUP BY bucket, host
ORDER BY bucket;| Language | Strength | Learning curve |
|---|---|---|
| PromQL | Compact, excellent for rates and alert expressions | Unusual at first, quick once learned |
| Flux | Powerful data scripting and transformation | Steeper; InfluxData has signalled it is in maintenance mode, so check its status before committing |
| InfluxQL | SQL-like and familiar | Easy, but less capable |
| SQL | Universal skill, joins, window functions, BI tool support | Lowest for most teams |
Language choice affects hiring and maintenance more than most people expect. SQL skills are everywhere; PromQL and Flux skills are specialized.
6. Scaling, Retention and High Availability
InfluxDB. Retention is defined per bucket (v2) and old data is dropped automatically. Clustering and high availability are typically part of the commercial editions, while open source deployments are usually single node with backups.
Prometheus. A single Prometheus server keeps data on local disk and is intentionally simple. For high availability you run two identical servers scraping the same targets. For long retention and global views, the usual answer is remote write to a long-term backend (for example Thanos, Mimir or VictoriaMetrics), which adds moving parts.
TimescaleDB. You inherit PostgreSQL’s mature toolbox: streaming replication, point-in-time recovery, pg_dump, connection pooling and role-based security. Native compression and continuous aggregates (pre-computed rollups) keep large datasets manageable, and retention policies drop old chunks automatically.
| Need | Simplest fit |
|---|---|
| “Keep 15 days of metrics, alert on problems” | Prometheus alone |
| “Keep years of sensor data with rollups” | TimescaleDB or InfluxDB |
| “Join metrics with customer or asset tables” | TimescaleDB |
| “Global view across many clusters” | Prometheus + a long-term backend |
| “Push data from thousands of devices” | InfluxDB or TimescaleDB |
7. Ecosystem and Integrations
| Integration | InfluxDB | Prometheus | TimescaleDB |
|---|---|---|---|
| Grafana | Native data source | Native data source | Via the PostgreSQL data source |
| Telegraf | First-class output | Output plugin for scraping | PostgreSQL output plugin |
| Kubernetes | Works, less native | De facto standard (service discovery, operators) | Works via operators for PostgreSQL |
| Exporters (node, MySQL, etc.) | Via Telegraf inputs | Huge exporter library | Via Prometheus adapters or Telegraf |
| BI and reporting tools | Limited | Limited | Any tool that speaks PostgreSQL |
| IoT and MQTT pipelines | Common | Uncommon | Common |
If your stack is Kubernetes-heavy, Prometheus integration is hard to beat. If your team lives in SQL and BI tools, TimescaleDB fits naturally. If you collect data from many heterogeneous sources and want a purpose-built store with its own UI, InfluxDB is a strong option.
8. Which One Should You Choose?
                      What is your main goal?
                               │
        ┌──────────────────────┼───────────────────────┐
   Monitoring &           General time series      Time series + relational
   alerting for           storage (IoT, events,    data, SQL, BI, joins
   servers / K8s          sensors, metrics)               │
        │                       │                   TIMESCALEDB
   PROMETHEUS              INFLUXDB                (PostgreSQL skills
   (+ Alertmanager,        (push model, UI,         already in team)
    Grafana)               Telegraf ecosystem)
| Scenario | Recommendation |
|---|---|
| Monitor Linux servers, containers and Kubernetes with alerts | Prometheus |
| Collect IoT or sensor data from remote devices | InfluxDB or TimescaleDB |
| Store metrics for years and report on them with SQL and BI tools | TimescaleDB |
| Correlate time series with customers, assets or orders | TimescaleDB |
| Small team, want a single binary and a UI with minimal fuss | InfluxDB |
| Already run PostgreSQL and want minimal new technology | TimescaleDB |
| Need PromQL compatibility for existing dashboards and alerts | Prometheus (or a compatible backend) |
| Fast-growing metrics with a global view | Prometheus + long-term storage |
9. Can You Combine Them?
Yes, and many production stacks do. A common pattern is Prometheus for real-time monitoring and alerting with a long-term store behind it for history. Another is Telegraf feeding both InfluxDB and TimescaleDB during a migration or evaluation. Grafana can query all three in a single dashboard, which makes side-by-side testing straightforward.
A practical evaluation approach:
- Pick one representative workload (for example, 50 servers or 1,000 devices).
- Send the same data to two candidates for two weeks.
- Compare disk usage, query speed, memory use and how easy alerting and reporting feel to your team.
10. Common Selection Mistakes
| Mistake | Why it hurts | Better approach |
|---|---|---|
| Using Prometheus as a long-term data warehouse | Local storage is not designed for years of history | Add remote write to a long-term backend, or choose another store |
| Choosing by benchmark charts alone | Results depend on cardinality, batch size and queries | Benchmark with your own data |
| Ignoring cardinality | Unique IDs in labels or tags cause memory blowups | Keep unbounded values out of labels and tags |
| Picking a language nobody on the team knows | Slows adoption and hiring | Weigh SQL familiarity heavily |
| Skipping retention and downsampling | Disks fill and queries slow down | Define retention and rollups from day one |
| Expecting InfluxDB or Prometheus to handle relational joins | Awkward or impossible | Use TimescaleDB when joins matter |
| Running any TSDB without backups | Metrics are still business data | Schedule tested backups |
11. FAQ
Is InfluxDB better than Prometheus?
They solve different problems. Prometheus is a monitoring system with alerting built around a pull model. InfluxDB is a general time series database that accepts pushed data. For Kubernetes monitoring, Prometheus is the usual choice; for IoT and event data, InfluxDB is often a better fit.
Is TimescaleDB faster than InfluxDB?
It depends on the workload. Published comparisons conflict, and results change with versions and tuning. Test with your own data before deciding.
Can TimescaleDB replace Prometheus?
Not directly. It has no scraping, PromQL or Alertmanager. It can, however, serve as long-term storage for metrics, and it is excellent when you need SQL and joins.
Do I need to know PostgreSQL to use TimescaleDB?
Yes, at least the basics. That is also its advantage: existing PostgreSQL skills, drivers and tools carry over.
Which is easiest to install?
Prometheus is a single binary with a small config file. InfluxDB and TimescaleDB are also straightforward on Linux. See our guides: How to Install InfluxDB on Ubuntu 26.04 and How to Install TimescaleDB on Ubuntu 26.04.
Which is best for IoT?
InfluxDB and TimescaleDB both work well. Choose InfluxDB for a purpose-built time series store with a UI, and TimescaleDB when the device data must be joined with relational information.
12. Conclusion
There is no universal winner. Prometheus is the natural choice for infrastructure and Kubernetes monitoring with alerting. InfluxDB is a flexible, purpose-built store for pushed time series such as IoT and events. TimescaleDB gives you time series performance without leaving PostgreSQL, which is ideal when SQL, joins and reporting matter.
Start from your workload, your team’s skills and your retention needs, run a short pilot with real data, and remember that combining tools is normal.
Related posts:
 How to Install MongoDB 8.0 on Rocky Linux 10.2: Complete Setup Guide with SELinux & Authentication
 How to Install CouchDB 3.5 on Rocky Linux 10.2: Docker, Source Build & Production Setup
 How To Install Apache CouchDB on CentOS 8 step-by-step guide
 How To Install Redis On Ubuntu 20.04
Apache CouchDB: A Versatile and Scalable NoSQL Database Solution
How To Install Redis On Ubuntu 20.04
Apache CouchDB: A Versatile and Scalable NoSQL Database Solution
 MongoDB Installation Guide for Ubuntu 24.04
 NewSQL: Combining SQL Reliability with NoSQL Scalability
 How to Run Redis on Kubernetes Using StatefulSet
