How to Use Horizontal Pod Autoscaler (HPA) in Kubernetes

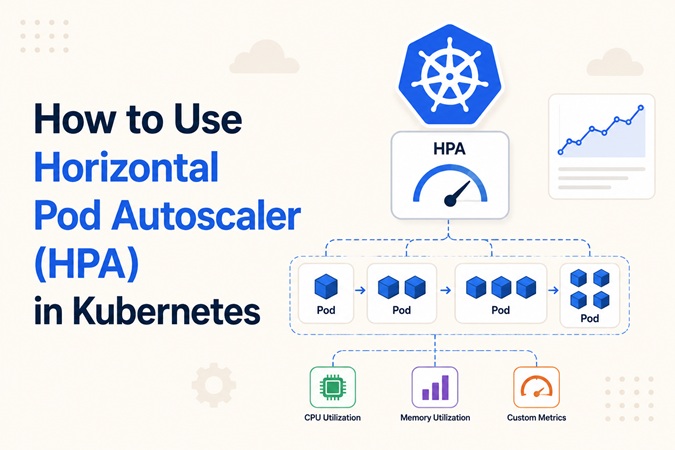
The Horizontal Pod Autoscaler (HPA) automatically adjusts the number of pod replicas in a Deployment, ReplicaSet, or StatefulSet based on observed metrics like CPU utilization, memory usage, or custom application-level signals. Instead of manually scaling workloads up during traffic spikes and back down afterward, HPA continuously watches your metrics and reconciles replica count toward a target you define. This guide walks through setting up HPA using the stable autoscaling/v2 API on an existing Kubernetes cluster, covering CPU/memory scaling, custom and external metrics, scaling behavior tuning, and the pitfalls that most commonly cause HPA to silently do nothing.
By the end of this tutorial you’ll have Metrics Server installed, a working CPU-based HPA scaling a real Deployment under load, and enough context to extend it to memory, custom, and external metrics for production use.
Table of Contents
- Prerequisites
- HPA Scaling Sources Compared
- Architecture: How the HPA Control Loop Works
- Step 1: Install Metrics Server
- Step 2: Deploy a Sample Workload
- Step 3: Create a CPU-Based HPA
- Step 4: Generate Load and Watch It Scale
- Scaling on Memory and Multiple Metrics
- Scaling on Custom and External Metrics
- Tuning Scaling Behavior
- HPA vs VPA vs Cluster Autoscaler
- Troubleshooting
- Removing an HPA
- FAQ
- Related Reads on bckinfo.com
Prerequisites
Before configuring HPA, make sure your environment meets the following requirements:
- A running Kubernetes cluster (v1.23+) with
kubectlconfigured and pointed at it - Cluster-admin or sufficient RBAC permissions to install Metrics Server and create autoscaling resources
- A Deployment or StatefulSet whose containers declare CPU and/or memory
requests— HPA calculates utilization as a percentage of requests, so workloads without requests set cannot be scaled on resource metrics - Metrics Server installed in the cluster (covered in Step 1) for CPU/memory-based scaling; a custom metrics adapter (like Prometheus Adapter) if you plan to scale on application-level metrics
HPA Scaling Sources Compared
HPA’s autoscaling/v2 API supports four distinct metric source types, each suited to different scaling scenarios.
| Metric Type | Best For | Requires | Example |
|---|---|---|---|
| Resource (CPU/Memory) | General-purpose workloads, first HPA setup | Metrics Server only | Scale when average CPU exceeds 70% of requests |
| Pods | App-level throughput signals per pod | Custom metrics adapter (e.g., Prometheus Adapter) | Scale on requests-per-second per pod |
| Object | Metrics tied to a specific Kubernetes object, not per-pod | Custom metrics adapter | Scale based on an Ingress controller’s total request rate |
| External | Signals from outside the cluster entirely | External metrics adapter | Scale based on an SQS/Pub-Sub queue depth |
Most teams start with Resource metrics since they require nothing beyond Metrics Server, then layer in Pods or External metrics once CPU/memory alone doesn’t reflect real application load (e.g., an I/O-bound service that stays CPU-idle even while overloaded with requests).
Architecture: How the HPA Control Loop Works
HPA runs as a controller inside kube-controller-manager, polling metrics on a fixed interval and adjusting the target’s replica count accordingly.
                    ┌───────────────────────────────────────────────────┐
                    │                  Kubernetes Cluster               │
                    │                                                   │
                    │   ┌─────────────────┐        ┌──────────────────┐ │
                    │   │  HPA Controller │───────►│ Metrics Server   │ │
                    │   │  (every ~15s)   │◄───────│ (resource.k8s.io)│ │
                    │   └────────┬────────┘        └──────────────────┘ │
                    │            │                                      │
                    │            │  reads metrics, computes:            │
                    │            │  desiredReplicas = ceil[             │
                    │            │    currentReplicas *                 │
                    │            │    (currentMetricValue /             │
                    │            │     desiredMetricValue) ]            │
                    │            ▼                                      │
                    │   ┌─────────────────────┐                         │
                    │   │  scaleTargetRef     │                         │
                    │   │  (Deployment/       │                         │
                    │   │   StatefulSet/RS)   │                         │
                    │   └──────────┬──────────┘                         │
                    │              │ updates .spec.replicas             │
                    │              ▼                                    │
                    │   ┌────────────────────────────────────┐          │
                    │   │   ReplicaSet scales Pods up/down   │          │
                    │   └────────────────────────────────────┘          │
                    │                                                   │
                    └───────────────────────────────────────────────────┘
                                          ▲
                              ┌───────────┴───────────┐
                              │  Custom/External      │
                              │  Metrics Adapters     │
                              │  (Prometheus Adapter  │
                              │ KEDA, cloud provider  │
                              │ external metrics API) │
                              └───────────────────────┘
The controller never scales instantly to the “correct” number in one step for large jumps — it recalculates every sync interval and moves toward the target gradually, further shaped by the behavior policies covered later in this guide.
Step 1: Install Metrics Server
Most managed Kubernetes distributions (EKS, GKE, AKS) don’t ship Metrics Server by default, so install it explicitly:
kubectl apply -f https://github.com/kubernetes-sigs/metrics-server/releases/latest/download/components.yamlVerify it’s running:
kubectl -n kube-system get deployment metrics-serverOn some self-managed clusters (kubeadm, kind, k3s with custom CNI), Metrics Server fails with certificate errors because it tries to verify kubelet TLS certificates that aren’t signed by a trusted CA. If you hit this in testing environments, patch the deployment:
kubectl -n kube-system patch deployment metrics-server --type=json \
  -p='[{"op":"add","path":"/spec/template/spec/containers/0/args/-","value":"--kubelet-insecure-tls"}]'
Avoid --kubelet-insecure-tls in production clusters — fix the underlying certificate trust chain instead.
Confirm metrics are actually flowing:
kubectl top nodes
kubectl top pods -A
If both commands return real numbers instead of an error, Metrics Server is working correctly.
Step 2: Deploy a Sample Workload
Deploy a simple CPU-bound application to scale against. The classic php-apache image works well for this since it’s easy to load-test.
kubectl create deployment php-apache --image=registry.k8s.io/hpa-example --port=80Set explicit CPU requests and limits — this step is mandatory, since HPA calculates utilization as a percentage of the requested value:
kubectl set resources deployment php-apache --requests=cpu=200m --limits=cpu=500mExpose it internally so the load generator in Step 4 can reach it:
kubectl expose deployment php-apache --port=80Step 3: Create a CPU-Based HPA
Create an HPA using the stable autoscaling/v2 API:
apiVersion: autoscaling/v2
kind: HorizontalPodAutoscaler
metadata:
  name: php-apache
spec:
  scaleTargetRef:
    apiVersion: apps/v1
    kind: Deployment
    name: php-apache
  minReplicas: 1
  maxReplicas: 10
  metrics:
    - type: Resource
      resource:
        name: cpu
        target:
          type: Utilization
          averageUtilization: 50
Apply it:
kubectl apply -f php-apache-hpa.yamlOr, for a quick test without a manifest file:
kubectl autoscale deployment php-apache --cpu-percent=50 --min=1 --max=10Confirm it registered:
kubectl get hpa php-apacheExpected output (target shows <unknown> until the first metrics sync completes, usually within 15–30 seconds):
NAME         REFERENCE               TARGETS   MINPODS   MAXPODS   REPLICAS   AGE
php-apache   Deployment/php-apache   0%/50%    1         10        1          32s
Step 4: Generate Load and Watch It Scale
Open a second terminal and run a load generator pod against the service:
kubectl run load-generator --rm --tty -i --image=busybox:1.36 --restart=Never -- \
  /bin/sh -c "while sleep 0.01; do wget -q -O- http://php-apache; done"
In your original terminal, watch the HPA react in real time:
kubectl get hpa php-apache -wWithin a couple of minutes you should see TARGETS climb well above 50% and REPLICAS increase to compensate:
NAME         REFERENCE               TARGETS    MINPODS   MAXPODS   REPLICAS   AGE
php-apache   Deployment/php-apache   305%/50%   1         10        1          3m
php-apache   Deployment/php-apache   305%/50%   1         10        7          3m30s
php-apache   Deployment/php-apache   26%/50%    1         10        7          4m
Stop the load generator (Ctrl+C, then the pod self-deletes due to --rm) and watch REPLICAS gradually scale back down toward minReplicas over the following several minutes — this cooldown delay is intentional and controlled by the default stabilization window discussed below.
Scaling on Memory and Multiple Metrics
HPA supports multiple metrics in a single object — when more than one is defined, HPA calculates the desired replica count for each metric independently and uses whichever suggests the highest replica count.
apiVersion: autoscaling/v2
kind: HorizontalPodAutoscaler
metadata:
  name: web-api
spec:
  scaleTargetRef:
    apiVersion: apps/v1
    kind: Deployment
    name: web-api
  minReplicas: 3
  maxReplicas: 50
  metrics:
    - type: Resource
      resource:
        name: cpu
        target:
          type: Utilization
          averageUtilization: 70
    - type: Resource
      resource:
        name: memory
        target:
          type: AverageValue
          averageValue: 512Mi
Be cautious mixing HPA and Vertical Pod Autoscaler (VPA) on the same resource metric for the same workload — the two controllers can fight each other, with VPA resizing pods while HPA is simultaneously changing replica count based on utilization of that same resource. If you need both, scale on CPU with HPA and manage memory sizing with VPA (or vice versa), not both on the same metric.
Scaling on Custom and External Metrics
CPU and memory don’t always reflect real application load — an I/O-bound or queue-processing service can be overwhelmed with work while staying nearly idle on CPU. For these cases, use Pods or External metric types, backed by an adapter like Prometheus Adapter or KEDA.
Scaling on a per-pod custom metric (e.g., requests per second)
apiVersion: autoscaling/v2
kind: HorizontalPodAutoscaler
metadata:
  name: web-api
spec:
  scaleTargetRef:
    apiVersion: apps/v1
    kind: Deployment
    name: web-api
  minReplicas: 2
  maxReplicas: 20
  metrics:
    - type: Pods
      pods:
        metric:
          name: http_requests_per_second
        target:
          type: AverageValue
          averageValue: "1000"
Scaling on an external queue depth
apiVersion: autoscaling/v2
kind: HorizontalPodAutoscaler
metadata:
  name: queue-processor
spec:
  scaleTargetRef:
    apiVersion: apps/v1
    kind: Deployment
    name: queue-processor
  minReplicas: 1
  maxReplicas: 100
  metrics:
    - type: External
      external:
        metric:
          name: sqs_queue_messages_visible
          selector:
            matchLabels:
              queue: orders
        target:
          type: AverageValue
          averageValue: "30"
Both patterns require a metrics adapter registered with the custom.metrics.k8s.io or external.metrics.k8s.io API — Metrics Server alone only serves the built-in metrics.k8s.io API used for CPU/memory.
Tuning Scaling Behavior
By default, HPA scales up quickly but scales down conservatively to avoid flapping. For production workloads, define explicit behavior policies rather than relying on the defaults:
apiVersion: autoscaling/v2
kind: HorizontalPodAutoscaler
metadata:
  name: web-api
spec:
  scaleTargetRef:
    apiVersion: apps/v1
    kind: Deployment
    name: web-api
  minReplicas: 3
  maxReplicas: 30
  metrics:
    - type: Resource
      resource:
        name: cpu
        target:
          type: Utilization
          averageUtilization: 70
  behavior:
    scaleUp:
      stabilizationWindowSeconds: 0
      policies:
        - type: Percent
          value: 100
          periodSeconds: 60
    scaleDown:
      stabilizationWindowSeconds: 300
      policies:
        - type: Pods
          value: 2
          periodSeconds: 60
This configuration allows replicas to double within a 60-second window during a spike (scaleUp), while restricting scale-down to at most 2 pods per minute and requiring 5 minutes of sustained lower load before scaling down begins (scaleDown) — a common pattern for absorbing traffic bursts without thrashing.
HPA vs VPA vs Cluster Autoscaler
Kubernetes offers three distinct autoscaling mechanisms that solve different problems and are frequently confused with one another.
| Autoscaler | Scales | Triggers On | Typical Use Case |
|---|---|---|---|
| HPA | Number of pod replicas | CPU, memory, custom, external metrics | Stateless workloads under variable traffic |
| VPA (Vertical Pod Autoscaler) | CPU/memory requests & limits of existing pods | Historical resource usage | Right-sizing pods that are consistently over- or under-provisioned |
| Cluster Autoscaler | Number of nodes in the cluster | Unschedulable pods due to insufficient node capacity | Ensuring the cluster itself has enough capacity for HPA/VPA-driven pod counts |
In practice, HPA and Cluster Autoscaler are commonly deployed together: HPA decides a workload needs more pods, and if the cluster lacks capacity to schedule them, Cluster Autoscaler adds nodes to make room.
Troubleshooting
| Symptom | Likely Cause | Fix |
|---|---|---|
TARGETS shows <unknown>/50% indefinitely | Metrics Server not installed, not running, or containers lack resource requests | Run kubectl top pods to confirm metrics flow; add resources.requests.cpu to the target Deployment |
| HPA never scales despite high load | scaleTargetRef doesn’t match an existing Deployment/StatefulSet name, or wrong apiVersion | Run kubectl describe hpa <name> and check the Events section for reference errors |
| Replicas oscillate rapidly up and down (“flapping”) | No behavior.scaleDown.stabilizationWindowSeconds set, or a minReplicas too close to real baseline load | Add explicit behavior policies as shown above; increase the stabilization window |
Pods stably Ready but metrics still ignored right after startup | Pod rapidly toggled between Ready/Unready during a startup CPU spike | Configure a startupProbe or delay readinessProbe until the CPU spike subsides, and consider --horizontal-pod-autoscaler-cpu-initialization-period |
Custom metric HPA shows FailedGetPodsMetric | No custom metrics adapter installed, or the adapter isn’t exposing the named metric | Verify with kubectl get --raw "/apis/custom.metrics.k8s.io/v1beta1" and confirm the metric is registered by your adapter (e.g., Prometheus Adapter) |
HPA scales up but pods stay Pending | Cluster lacks node capacity for the new replicas | Install/verify Cluster Autoscaler, or manually add node capacity |
kubectl autoscale fails with a deprecated-flag error | Older --cpu-percent syntax used against a newer kubectl version | Use --cpu=<percent> instead, per current kubectl autoscale syntax |
| Scale-down never happens even after load drops | Default 5-minute stabilization window still in effect, or another metric (e.g., memory) is still above target | Wait out the stabilization window, or check kubectl describe hpa to see which metric is currently driving the decision |
Removing an HPA
kubectl delete hpa php-apacheThis removes only the autoscaler object — the Deployment and its current replica count remain untouched, so scale it manually afterward if needed:
kubectl scale deployment php-apache --replicas=1Clean up the sample resources from this guide entirely:
kubectl delete deployment php-apache
kubectl delete service php-apache
kubectl delete pod load-generator --ignore-not-found
FAQ
Do I need Metrics Server for HPA to work at all?
Only for CPU/memory-based scaling. Custom and external metrics rely on separate adapters (Prometheus Adapter, KEDA, or a cloud provider’s external metrics API) and don’t require Metrics Server, though most clusters install it anyway since it also powers kubectl top.
What’s the difference between autoscaling/v1 and autoscaling/v2?autoscaling/v1 only supports CPU-based scaling. autoscaling/v2 (stable since Kubernetes 1.23) adds memory, custom, and external metrics, multiple simultaneous metrics, and fine-grained behavior policies — new deployments should always use v2.
Can HPA scale a StatefulSet, or only Deployments?
Both, along with any resource that implements the scale subresource — Deployments, ReplicaSets, StatefulSets, and certain custom resources that expose a compatible scale endpoint.
Why does scaling down take so much longer than scaling up?
By design. The default scaleDown.stabilizationWindowSeconds is 300 seconds specifically to avoid removing pods in response to a brief dip in load, then immediately needing to add them back — tune it lower only if you fully understand the flapping risk for your workload.
Can HPA scale a Deployment to zero replicas?
Not natively — minReplicas must be at least 1 in standard HPA. Scale-to-zero requires an event-driven autoscaler like KEDA, which extends the same autoscaling/v2 HPA object with event-source-based triggers capable of scaling down to zero when idle.
Related posts:
 How to Back Up and Restore Kubernetes Cluster Using Velero (2026 Guide)
 How to Deploy Jenkins on Kubernetes
 Kubernetes Troubleshooting: 50 kubectl Commands Every Administrator Should Know
 How to Run Redis on Kubernetes Using StatefulSet
 Kubernetes Network Policies Explained: Secure Pod-to-Pod Communication (2026 Guide)
 How to Deploy PostgreSQL on Kubernetes with Persistent Storage (2026 Guide)
 Top 15 Kubernetes Interview Questions and Answers for Beginners (2025)
 How to Install Helm on Ubuntu 26.04 LTS (Complete Guide 2026)
