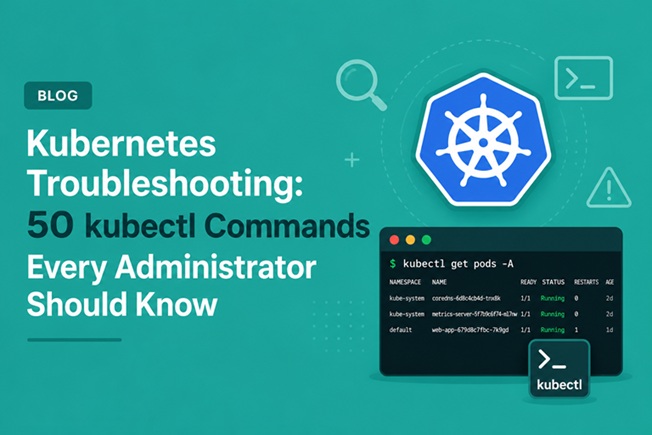
Kubernetes Troubleshooting: 50 kubectl Commands Every Administrator Should Know

Running Kubernetes in production means one certainty: sooner or later, something will break. A pod refuses to start, a service stops responding, a node silently goes NotReady, or an application behaves fine locally but fails inside the cluster. When that happens, kubectl is the very first tool every administrator reaches for.
The problem isn’t that kubectl lacks capability — it’s the opposite. With dozens of subcommands, flags, and output formats, it’s easy to only ever use a handful of commands and miss the ones that would have saved hours of digging. This guide compiles 50 practical kubectl commands organized by troubleshooting scenario, so you can go straight to the command that matches the symptom you’re seeing, rather than searching documentation mid-incident.
Table of Contents
- Why kubectl Mastery Matters for Troubleshooting
- Cluster and Node Health Commands
- Pod Inspection and Debugging Commands
- Logs and Events Commands
- Networking and Service Troubleshooting Commands
- Storage and Volume Troubleshooting Commands
- Deployment, ReplicaSet, and Rollout Commands
- RBAC and Security Troubleshooting Commands
- Resource Usage and Performance Commands
- Advanced Debugging and Emergency Commands
- Building Your Own Troubleshooting Workflow
- Conclusion
Why kubectl Mastery Matters for Troubleshooting
Kubernetes abstracts away a lot of infrastructure complexity, but that abstraction can also hide the root cause of a problem behind several layers — the pod, the node, the container runtime, the network overlay, the scheduler, and the control plane all interact before an application actually serves traffic. kubectl is the interface that lets you peel back each of those layers one at a time.
Administrators who only know kubectl get pods and kubectl logs often get stuck the moment a problem isn’t a straightforward crash. Knowing commands that inspect scheduling decisions, node conditions, endpoint objects, RBAC bindings, and low-level resource metrics turns a guessing game into a systematic diagnosis. That’s the goal of this list: not just commands, but commands mapped to the failure scenarios where they matter most.
Each command below includes a short explanation of when and why you’d use it, so this list can double as both a learning resource and a quick-reference cheat sheet during an actual incident.
Cluster and Node Health Commands
Before diagnosing an individual pod, it’s worth confirming the cluster itself is healthy. Many application-level symptoms actually trace back to node or control-plane issues.
1. kubectl cluster-info
Displays the addresses of the control plane and core services. Useful as a first sanity check to confirm kubectl can reach the API server at all.
2. kubectl get nodes
Lists all nodes and their status. A node showing NotReady is often the root cause of pods stuck in Pending.
3. kubectl get nodes -o wide
Adds IP addresses, OS image, and container runtime version — helpful when troubleshooting node-specific compatibility issues.
4. kubectl describe node <node-name>
Shows detailed node conditions (MemoryPressure, DiskPressure, PIDPressure), allocatable resources, and recent events. This is usually the first command to run when a node is misbehaving.
5. kubectl top nodes
Displays real-time CPU and memory usage per node (requires metrics-server). Useful for spotting resource-starved nodes before they affect scheduling.
6. kubectl get componentstatuses
Reports the health of control plane components like the scheduler and controller-manager (deprecated in newer versions but still useful on older clusters).
7. kubectl get events --all-namespaces --sort-by='.lastTimestamp'
Lists cluster-wide events sorted chronologically, helping correlate node issues with pod scheduling failures across namespaces.
8. kubectl cordon <node-name>
Marks a node as unschedulable without evicting existing pods — useful when you want to stop new workloads from landing on a suspect node while investigating.
9. kubectl drain <node-name> --ignore-daemonsets
Safely evicts pods from a node before maintenance or replacement, respecting PodDisruptionBudgets.
10. kubectl uncordon <node-name>
Re-enables scheduling on a node after maintenance or once an issue is resolved.
Pod Inspection and Debugging Commands
Pods are where most day-to-day troubleshooting happens. These commands help you understand why a pod isn’t running, why it keeps restarting, or why it behaves unexpectedly.
11. kubectl get pods -o wide
Shows pod status along with the node it’s scheduled on and its internal IP — a quick way to confirm scheduling and placement.
12. kubectl describe pod <pod-name>
Arguably the single most useful troubleshooting command in Kubernetes. It reveals the scheduling decision, container statuses, resource requests/limits, volume mounts, and — critically — the Events section at the bottom, which often states the exact reason a pod failed to start.
13. kubectl get pods --field-selector=status.phase=Pending
Filters for pods stuck in Pending, usually pointing to insufficient resources, unsatisfied node selectors, or taints without matching tolerations.
14. kubectl get pods --field-selector=status.phase=Failed
Lists pods that have failed outright, useful for quickly spotting problematic workloads across a namespace.
15. kubectl get pods -l app=<label>
Filters pods by label, essential when working with deployments that manage many replicas and you need to isolate a specific subset.
16. kubectl exec -it <pod-name> -- /bin/sh
Opens an interactive shell inside a running container, letting you inspect files, environment variables, or network connectivity directly from within the pod.
17. kubectl exec <pod-name> -- env
Prints all environment variables inside the container — useful when an application is misbehaving due to a missing or incorrect config value.
18. kubectl get pod <pod-name> -o yaml
Dumps the full pod manifest as applied by the API server, including defaults and status fields not visible in the original YAML you submitted.
19. kubectl get pod <pod-name> -o json | jq '.status'
Extracts just the status block in JSON, useful for scripting or when you need precise condition timestamps.
20. kubectl delete pod <pod-name>
Forces a pod to be recreated by its controller. Often used as a quick recovery step once the underlying cause has been identified and fixed, or to force a fresh scheduling attempt.
21. kubectl get pod <pod-name> --show-labels
Displays all labels attached to a pod, useful for confirming whether a pod matches a Service’s selector or a NetworkPolicy’s scope.
22. kubectl debug <pod-name> -it --image=busybox
Attaches an ephemeral debug container to a running pod without restarting it — extremely useful for inspecting distroless containers that don’t ship a shell.
Logs and Events Commands
Logs and events tell the story of what actually happened, often more precisely than the current pod state alone.
23. kubectl logs <pod-name>
Retrieves the container’s stdout/stderr logs — the default first step when an application isn’t behaving as expected.
24. kubectl logs <pod-name> -c <container-name>
Retrieves logs from a specific container within a multi-container pod, necessary once sidecars are involved.
25. kubectl logs <pod-name> --previous
Shows logs from the previous instance of a container that has crashed and restarted — essential for diagnosing CrashLoopBackOff since the current container may not have logged anything yet.
26. kubectl logs -f <pod-name>
Streams logs in real time, useful for watching behavior as you reproduce an issue.
27. kubectl logs <pod-name> --since=1h
Limits log output to a recent time window, avoiding an overwhelming dump on long-running pods.
28. kubectl logs -l app=<label> --all-containers
Aggregates logs across all pods matching a label, handy for deployments with multiple replicas where the failure could be on any instance.
29. kubectl get events --field-selector involvedObject.name=<pod-name>
Filters cluster events for a specific object, narrowing down exactly what the scheduler, kubelet, or controller reported about that pod.
30. kubectl get events --watch
Streams events live as they occur, useful for watching what happens in real time as you apply a change or trigger a redeploy.
Networking and Service Troubleshooting Commands
Networking issues are notoriously hard to diagnose because the failure can occur at the pod, service, DNS, or ingress layer. These commands help isolate where exactly the breakdown happens.
31. kubectl get svc
Lists services and their cluster IPs, ports, and types — the starting point for confirming a service exists and is configured as expected.
32. kubectl describe svc <service-name>
Shows the service’s selector and, importantly, its Endpoints. If Endpoints is empty, the service’s selector doesn’t match any running pod — one of the most common causes of “service not reachable” issues.
33. kubectl get endpoints <service-name>
Directly lists the pod IPs backing a service. An empty result confirms the selector/label mismatch suspected from the describe output above.
34. kubectl get ingress
Lists Ingress resources and their configured hosts and backend services, useful for confirming routing rules are actually registered.
35. kubectl describe ingress <ingress-name>
Shows detailed backend and TLS configuration for an Ingress, along with any related events from the Ingress Controller.
36. kubectl exec -it <pod-name> -- nslookup <service-name>
Tests DNS resolution from inside a pod, useful for isolating CoreDNS issues from actual service connectivity issues.
37. kubectl exec -it <pod-name> -- curl -v <service-name>:<port>
Tests direct connectivity to a service from within the cluster, helping determine whether the issue is network-layer or application-layer.
38. kubectl get networkpolicies
Lists all NetworkPolicy objects in a namespace — essential when connectivity between pods that used to work suddenly stops after a policy change.
39. kubectl describe networkpolicy <policy-name>
Shows the exact ingress/egress rules of a NetworkPolicy, helping confirm whether a specific pod-to-pod connection is allowed or blocked.
40. kubectl port-forward svc/<service-name> 8080:80
Forwards a local port directly to a service inside the cluster, letting you test it from your machine without going through Ingress or a LoadBalancer.
Storage and Volume Troubleshooting Commands
Storage issues often manifest as pods stuck in Pending or ContainerCreating, and require inspecting a chain of objects: PVC, PV, and StorageClass.
41. kubectl get pvc
Lists PersistentVolumeClaims and their binding status. A PVC stuck in Pending usually means no matching PersistentVolume or StorageClass provisioner issue.
42. kubectl describe pvc <pvc-name>
Shows detailed binding events, including provisioner errors from the underlying cloud storage API — often the exact reason a volume failed to provision.
43. kubectl get pv
Lists all PersistentVolumes in the cluster along with their status and reclaim policy, useful for spotting orphaned or released volumes not being reused.
44. kubectl get storageclass
Lists available StorageClasses — useful when a PVC references a StorageClass name that doesn’t exist or isn’t installed on that cluster.
45. kubectl describe pod <pod-name> | grep -A5 Volumes
Extracts just the volume mount section of a pod description, a quick way to confirm the pod is referencing the correct PVC and mount path.
Deployment, ReplicaSet, and Rollout Commands
Beyond individual pods, many issues live at the controller level — deployments that won’t roll out, or ReplicaSets stuck reconciling.
46. kubectl rollout status deployment/<deployment-name>
Shows real-time rollout progress, useful for confirming whether a deployment is actually stuck or just slow.
47. kubectl rollout history deployment/<deployment-name>
Lists revision history for a deployment, letting you see what changed across recent updates.
48. kubectl rollout undo deployment/<deployment-name>
Rolls back a deployment to its previous revision — often the fastest mitigation when a new release introduces a regression.
49. kubectl get rs -l app=<label>
Lists ReplicaSets tied to a deployment, useful for spotting old ReplicaSets that failed to scale down, which can indicate a stuck rollout.
RBAC and Security Troubleshooting Commands
Permission errors are a common source of confusing failures, especially in multi-tenant clusters. This final command helps confirm whether an identity actually has the access it needs.
50. kubectl auth can-i <verb> <resource> --as=<user-or-serviceaccount>
Checks whether a specific user or service account is permitted to perform an action on a resource — the fastest way to confirm or rule out an RBAC misconfiguration as the cause of a “Forbidden” error.
Resource Usage and Performance Commands
While the 50 commands above cover the core troubleshooting workflow, a few additional patterns are worth layering on top once you suspect a performance-related issue rather than an outright failure.
Combining kubectl top pods with kubectl describe pod lets you compare actual usage against configured requests and limits. A pod being OOMKilled repeatedly, for instance, will show a Reason: OOMKilled in its last state, while kubectl top pods confirms whether memory usage was in fact climbing toward the configured limit before termination.
It’s also worth watching for the difference between requests and limits being set too conservatively — a common cause of throttling that doesn’t show up as a crash, only as unexplained latency. Reviewing kubectl describe node <node-name> alongside kubectl top pods --sort-by=cpu often reveals a node running close to its allocatable CPU capacity, causing every pod on it to be throttled simultaneously.
Advanced Debugging and Emergency Commands
Beyond the standard 50, a few advanced techniques are worth knowing for the toughest cases:
Ephemeral containers for distroless images
Many production images intentionally strip out shells and package managers for security. kubectl debug with --target attaches a debug container that shares the target container’s process namespace, letting you inspect processes and open files without modifying the original image.
API server direct queries
When kubectl itself seems to hang or behave inconsistently, querying the API server directly with kubectl get --raw /healthz bypasses client-side caching and confirms whether the control plane itself is responsive.
Dry-run diffs before applying changes
Running kubectl diff -f <manifest.yaml> shows exactly what would change before you apply a manifest, reducing the risk of an unexpected rollout during an already-tense incident.
Comparing live state against Git
For clusters managed via GitOps, comparing the output of kubectl get -o yaml against the source-controlled manifest quickly reveals configuration drift introduced by manual kubectl edit sessions — a frequent, quietly dangerous habit in incident response.
Building Your Own Troubleshooting Workflow
Knowing individual commands is only half the picture — the real value comes from combining them into a repeatable diagnostic sequence. A workflow that tends to work well in practice looks like this:
Step 1: Confirm cluster health. Start broad with kubectl get nodes and kubectl cluster-info to rule out an infrastructure-wide issue before assuming the problem is application-specific.
Step 2: Narrow to the affected object. Use label selectors and field selectors to isolate exactly which pods, services, or deployments are affected, rather than scrolling through an entire namespace.
Step 3: Read events before logs. The Events section in kubectl describe frequently explains scheduling or provisioning failures that never even reach the point of generating application logs.
Step 4: Check logs, including previous instances. Once you’ve confirmed the pod at least started, kubectl logs --previous combined with kubectl logs -f covers both what already happened and what’s happening now.
Step 5: Test connectivity layer by layer. For anything network-related, verify DNS resolution, then endpoint population, then direct connectivity — in that order — rather than assuming the entire network stack is broken based on one failed request.
Step 6: Confirm permissions last. RBAC issues are often the last thing administrators check, yet kubectl auth can-i takes seconds to run and can immediately rule out an entire category of “Forbidden” errors.
Documenting this sequence as a runbook — even informally, in a team wiki — turns individual command knowledge into a shared, repeatable process that reduces mean time to resolution across the whole team, not just for whoever happens to remember the right command that day.
Conclusion
kubectl is deceptively simple on the surface but extraordinarily deep once you get past get, describe, and logs. The 50 commands covered here span cluster health, pod internals, logs and events, networking, storage, rollouts, and RBAC — the layers where nearly every real-world Kubernetes incident eventually surfaces.
Rather than memorizing every flag, the more durable skill is recognizing which layer a symptom belongs to and knowing which command exposes that layer’s state. A pod stuck in Pending points you toward node conditions and resource requests; a service that’s unreachable points you toward endpoints and network policies; a pod that keeps restarting points you toward previous logs and OOM status.
Keep this list as a working reference, but treat the workflow in the previous section as the real takeaway: a systematic approach to troubleshooting will consistently outperform ad hoc guessing, no matter how many commands you have memorized.
Related posts:
 How to Back Up and Restore Kubernetes Cluster Using Velero (2026 Guide)
 How to Deploy Jenkins on Kubernetes
 Install and Configure K3s with NVIDIA GPU Operator on Ubuntu 22.04
 How to Install Kubernetes (K8s) on Ubuntu 24.04: A Step-by-Step Guide
 How to Install Kubernetes Cluster on Ubuntu 26.04 LTS Using kubeadm (2026 Guide)
 KubeSphere and Kubernetes Security: Complete Hardening Guide for 2026
 Kubernetes Services: ClusterIP, NodePort, LoadBalancer, and ExternalName Explained
 Persistent Volumes (PV) and Persistent Volume Claims (PVC) in Kubernetes Explained
