Loki + Grafana Log Aggregation Setup Guide (Docker & K8s)

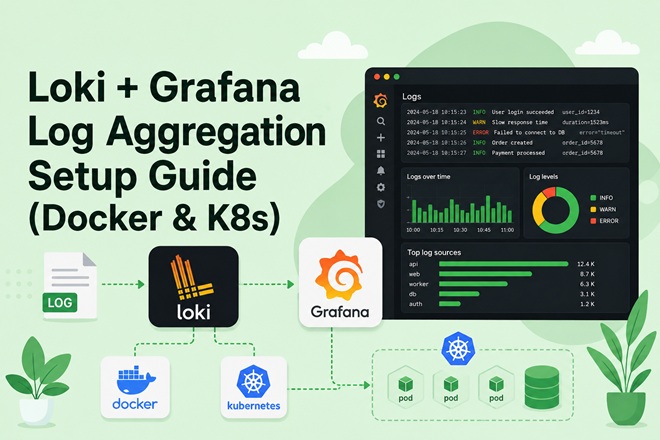
Logs pile up fast once you’re running more than a handful of containers, and grepping through docker logs or SSH-ing into individual nodes stops scaling almost immediately. This guide walks through deploying Grafana Loki alongside Promtail as a lightweight, cost-efficient alternative to Elasticsearch-based stacks — so you get centralized, searchable logs sitting right next to the metrics dashboards you already built with Prometheus and Grafana. Whether you’re running a handful of Docker Compose services or a full Kubernetes cluster, the steps below take you from zero to a working log pipeline, complete with LogQL query examples and a troubleshooting reference for the issues you’re most likely to hit along the way.
Table of Contents
- Why Loki for Log Aggregation
- Loki vs Alternatives: ELK, Graylog, HertzBeat
- Architecture Overview
- Prerequisites
- Docker Compose Setup: Loki + Promtail + Grafana
- Kubernetes Setup: Loki + Promtail via Helm
- Connecting Grafana to Loki
- Querying Logs with LogQL
- Retention and Storage Configuration
- Troubleshooting
- FAQ
- Related Articles
1. Why Loki for Log Aggregation
Grafana Loki is a horizontally scalable, highly available log aggregation system designed to be cost-effective and easy to operate. Unlike Elasticsearch, Loki does not index the full text of every log line — it only indexes metadata (labels), which keeps storage and compute costs dramatically lower.
If you already run Prometheus and Grafana (see our Prometheus + Grafana installation guide), Loki is a natural extension: it uses the same label-based model as Prometheus, and logs show up in the same Grafana dashboards you already built for metrics.
When Loki makes sense:
- You want logs and metrics correlated in one Grafana pane
- Your infrastructure is containerized (Docker, Kubernetes)
- You want to avoid the operational overhead and cost of an Elasticsearch cluster
- Log volume is high but full-text search on every field isn’t a hard requirement
When it doesn’t:
- You need complex full-text search across unstructured fields (Elasticsearch/OpenSearch is stronger here)
- You need long-term compliance archival with heavy ad-hoc querying
2. Loki vs Alternatives: ELK, Graylog, HertzBeat
| Feature | Loki + Grafana | ELK / Elasticsearch | Graylog | HertzBeat |
|---|---|---|---|---|
| Indexing model | Labels only (metadata) | Full-text index | Full-text index | Metrics-focused, not log-native |
| Storage cost | Low | High | Medium-High | Low |
| Query language | LogQL | Lucene / KQL | Lucene | N/A (not a log tool) |
| Setup complexity | Low-Medium | High | Medium | Low |
| Best fit | Cloud-native, Prometheus users | Enterprise search, SIEM | Security/audit logging | Infra/APM monitoring |
| Resource footprint | Light | Heavy | Medium | Light |
| Native Grafana integration | Yes (same vendor) | Via plugin | Via plugin | No |
We covered HertzBeat as a lightweight monitoring alternative in our HertzBeat installation guide — note that HertzBeat is metrics/APM-oriented, not a log aggregator, so it complements rather than competes with Loki.
3. Architecture Overview
                    ┌─────────────────────────────────────────┐
                   │             Grafana (UI)                │
                   │   Dashboards · Explore · Alerting       │
                   └────────────────┬──────────────┬─────────┘
                                    │              │
                         LogQL query│              │PromQL query
                                    ▼              ▼
                    ┌───────────────────┐   ┌───────────────────┐
                    │   Loki (server)   │   │   Prometheus      │
                    │  - Distributor    │   │ (existing setup)  │
                    │  - Ingester       │   └───────────────────┘
                    │  - Querier        │
                    │  - Compactor      │
                    └─────────┬─────────┘
                              │ push logs (HTTP)
              ┌───────────────┼───────────────┐
              ▼               ▼               ▼
     ┌───────────────┐┌───────────────┐┌───────────────┐
     │  Promtail #1  ││  Promtail #2  ││ Promtail #N   │
     │(agent on node)││(agent on node)││(agent on node)│
     └──────┬────────┘└───────┬───────┘└──────┬────────┘
            │                 │               │
            ▼                 ▼               ▼
      /var/log/*.log   docker container logs   K8s pod stdout
Loki has four logical components (distributor, ingester, querier, compactor) that can run as a single monolithic binary for small deployments, or scaled independently for production. Promtail runs as an agent on every node, tails log files or container stdout, attaches labels, and pushes to Loki.
4. Prerequisites
- Docker Engine 24+ and Docker Compose v2, or a Kubernetes cluster (v1.28+)
- An existing Grafana instance (or deploy one fresh — covered below)
- At least 2 vCPU / 4GB RAM for a small single-binary Loki deployment
- Persistent storage (local disk, or S3/MinIO for production — see our MinIO setup notes if you’re building that out)
5. Docker Compose Setup: Loki + Promtail + Grafana
5.1 Directory structure
mkdir -p loki-stack/{loki,promtail,grafana}
cd loki-stack
5.2 docker-compose.yml
version: "3.8"

services:
  loki:
    image: grafana/loki:3.1.0
    container_name: loki
    ports:
      - "3100:3100"
    volumes:
      - ./loki/loki-config.yaml:/etc/loki/local-config.yaml
      - loki-data:/loki
    command: -config.file=/etc/loki/local-config.yaml
    restart: unless-stopped
    networks:
      - monitoring

  promtail:
    image: grafana/promtail:3.1.0
    container_name: promtail
    volumes:
      - ./promtail/promtail-config.yaml:/etc/promtail/config.yaml
      - /var/log:/var/log:ro
      - /var/lib/docker/containers:/var/lib/docker/containers:ro
      - /var/run/docker.sock:/var/run/docker.sock:ro
    command: -config.file=/etc/promtail/config.yaml
    restart: unless-stopped
    depends_on:
      - loki
    networks:
      - monitoring

  grafana:
    image: grafana/grafana:11.2.0
    container_name: grafana
    ports:
      - "3000:3000"
    volumes:
      - grafana-data:/var/lib/grafana
    environment:
      - GF_SECURITY_ADMIN_PASSWORD=changeme_strong_password
    restart: unless-stopped
    depends_on:
      - loki
    networks:
      - monitoring

volumes:
  loki-data:
  grafana-data:

networks:
  monitoring:
    driver: bridge
If you already have Grafana running from the Prometheus + Grafana guide, skip the
grafanaservice and just join the samemonitoringnetwork.
5.3 loki/loki-config.yaml
auth_enabled: false

server:
  http_listen_port: 3100
  grpc_listen_port: 9096

common:
  path_prefix: /loki
  storage:
    filesystem:
      chunks_directory: /loki/chunks
      rules_directory: /loki/rules
  replication_factor: 1
  ring:
    instance_addr: 127.0.0.1
    kvstore:
      store: inmemory

schema_config:
  configs:
    - from: 2024-01-01
      store: tsdb
      object_store: filesystem
      schema: v13
      index:
        prefix: index_
        period: 24h

limits_config:
  retention_period: 720h   # 30 days, see section 9
  ingestion_rate_mb: 10
  ingestion_burst_size_mb: 20

compactor:
  working_directory: /loki/compactor
  retention_enabled: true
  delete_request_store: filesystem
5.4 promtail/promtail-config.yaml
server:
  http_listen_port: 9080
  grpc_listen_port: 0

positions:
  filename: /tmp/positions.yaml

clients:
  - url: http://loki:3100/loki/api/v1/push

scrape_configs:
  # Docker container logs
  - job_name: docker
    docker_sd_configs:
      - host: unix:///var/run/docker.sock
        refresh_interval: 5s
    relabel_configs:
      - source_labels: [__meta_docker_container_name]
        regex: '/(.*)'
        target_label: container
      - source_labels: [__meta_docker_container_log_stream]
        target_label: stream

  # System logs
  - job_name: syslog
    static_configs:
      - targets: [localhost]
        labels:
          job: syslog
          __path__: /var/log/*.log
5.5 Start the stack
docker compose up -d
docker compose logs -f loki promtail
Verify Loki is healthy:
curl -s http://localhost:3100/ready
# Expected output: ready
6. Kubernetes Setup: Loki + Promtail via Helm
If you’re already running the cluster from our HA Kubernetes with Keepalived and HAProxy guide, deploying the Loki stack via Helm is the fastest path to production.
6.1 Add the Grafana Helm repo
helm repo add grafana https://grafana.github.io/helm-charts
helm repo update
6.2 Create a namespace and values file
kubectl create namespace loggingloki-values.yaml:
loki:
  auth_enabled: false
  commonConfig:
    replication_factor: 1
  storage:
    type: filesystem
  limits_config:
    retention_period: 720h

singleBinary:
  replicas: 1
  persistence:
    enabled: true
    size: 20Gi

monitoring:
  selfMonitoring:
    enabled: false
  lokiCanary:
    enabled: false

gateway:
  enabled: false
6.3 Install Loki
helm install loki grafana/loki \
  --namespace logging \
  -f loki-values.yaml
6.4 Install Promtail as a DaemonSet
helm install promtail grafana/promtail \
  --namespace logging \
  --set "config.clients[0].url=http://loki.logging.svc.cluster.local:3100/loki/api/v1/push"
Confirm Promtail is running on every node:
kubectl get pods -n logging -l app.kubernetes.io/name=promtail -o wideYou should see one Promtail pod per worker node — this matches the DaemonSet pattern we used for Metrics Server.
7. Connecting Grafana to Loki
- In Grafana, go to Connections → Data sources → Add data source
- Select Loki
- Set the URL:
- Docker Compose:
http://loki:3100 - Kubernetes:
http://loki.logging.svc.cluster.local:3100
- Docker Compose:
- Click Save & Test — you should see “Data source successfully connected”
Once connected, open Explore, select the Loki data source, and pick a label (e.g., {container="nginx"}) to start browsing logs live.
8. Querying Logs with LogQL
LogQL syntax mirrors PromQL, which will feel familiar if you’ve already written Prometheus alerting rules.
# All logs from a specific container
{container="nginx"}

# Filter by text content
{container="nginx"} |= "error"

# Exclude noisy health-check lines
{container="nginx"} |= "error" != "/healthz"

# Parse JSON logs and filter by field
{container="api-backend"} | json | status_code >= 500

# Count error rate over 5 minutes (metric query)
sum(rate({container="nginx"} |= "error" [5m]))

# Top 10 containers by log volume in the last hour
topk(10, sum by (container) (count_over_time({job="docker"}[1h])))
Use the count_over_time and rate functions to build alert rules in Grafana — for example, alerting when error-log rate exceeds a threshold, correlated on the same dashboard as your Prometheus CPU/memory panels.
9. Retention and Storage Configuration
By default the config above retains logs for 30 days (720h). Adjust based on compliance needs and disk budget:
| Retention | Approx. storage (10 containers, moderate volume) | Use case |
|---|---|---|
| 72h (3 days) | ~2-5 GB | Dev/staging, debugging only |
| 720h (30 days) | ~20-50 GB | Standard production default |
| 2160h (90 days) | ~60-150 GB | Compliance-sensitive workloads |
For production beyond a single node, swap filesystem storage for S3-compatible object storage (AWS S3, or self-hosted MinIO) in both loki-config.yaml‘s common.storage block and the compactor’s delete_request_store.
10. Troubleshooting
| Symptom | Likely Cause | Fix |
|---|---|---|
| Grafana shows “no logs found” | Promtail not scraping the right target | Check promtail-config.yaml __path__ / docker_sd_configs, confirm with curl http://localhost:9080/targets |
curl /ready returns 503 | Loki still initializing or misconfigured schema | Check docker compose logs loki for schema_config errors |
| High memory usage on Loki | ingestion_rate_mb too high for available RAM | Lower ingestion_rate_mb / ingestion_burst_size_mb in limits_config |
| Promtail can’t read Docker socket | Permission denied on /var/run/docker.sock | Run Promtail container with correct group/UID or privileged: true in dev only |
| LogQL query times out | Query not label-filtered (full log scan) | Always start LogQL queries with a label selector {...} before applying ` |
| Duplicate log lines in Grafana | Multiple Promtail instances scraping the same file | Ensure only one Promtail per node/log source, check positions.yaml isn’t shared incorrectly |
| Kubernetes Promtail pod CrashLoopBackOff | Wrong Loki service URL in Helm values | Verify config.clients[0].url matches <service>.<namespace>.svc.cluster.local:3100 |
11. FAQ
Is Loki free and open-source?
Yes. Loki, Promtail, and Grafana are all open-source (AGPLv3 for Loki/Grafana core). Grafana Labs also offers a paid Grafana Cloud hosted option, but self-hosting as shown here has no licensing cost.
Can I run Loki without Grafana?
Technically yes — you can query Loki’s HTTP API directly (/loki/api/v1/query) — but you lose the dashboarding, alerting, and correlation with Prometheus metrics that make the stack valuable.
Does Loki replace Prometheus?
No. Prometheus handles metrics (numeric time series); Loki handles logs. They’re designed to run side by side and share the same Grafana frontend.
How does Loki compare to Elasticsearch for cost at scale?
Loki’s index-light design typically costs significantly less to store and operate at high log volume, because it avoids full-text indexing overhead. The trade-off is weaker ad-hoc full-text search compared to Elasticsearch.
Can Promtail replace Filebeat/Fluentd?
Yes, for Loki-based pipelines Promtail is the native equivalent of Filebeat (ELK) or Fluent Bit (Fluentd), purpose-built for pushing to Loki’s API.
Related posts:
 How to Set Up Prometheus and Grafana Monitoring Stack with Docker Compose
 Grafana Loki with Docker Compose: Centralized Log Aggregation Guide (2026)
 How To Install Grafana on Ubuntu 20.04 LTS
 How To Install Docker On CentOS 7
 How To Install Prometheus on Debian 11
 Setting Up an Ubuntu Docker Container with SSH Access
 How To Run Commands Inside Docker Containers: A Step-by-Step Guide
 MongoDB with Docker Compose: Authentication, Replica Set, and Production-Ready Setup
