Grafana Loki with Docker Compose: Centralized Log Aggregation Guide (2026)

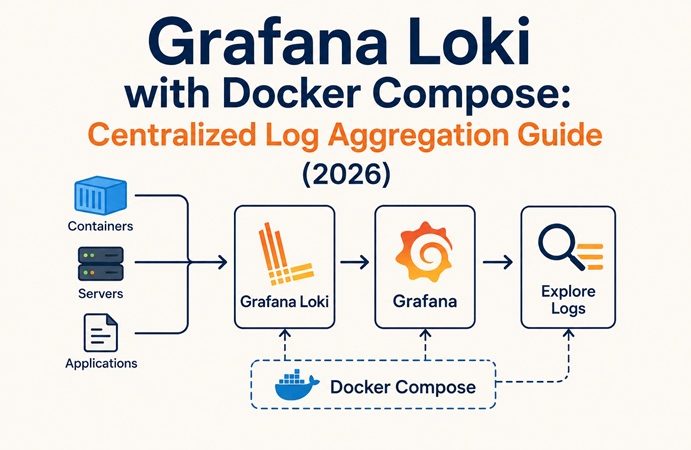
Table of Contents
- What is Grafana Loki and Why It Matters in 2026
- How Loki Works: Labels, Not Full-Text Index
- Important: Promtail is EOL — Use Grafana Alloy Instead
- Loki vs ELK Stack: When to Use Which
- Architecture Overview
- Prerequisites
- Project Structure
- Step 1: Loki Configuration
- Step 2: Grafana Alloy Configuration
- Step 3: The Full Docker Compose Stack
- Step 4: Start the Stack and Verify
- Step 5: Add Loki as a Data Source in Grafana
- Step 6: Writing LogQL Queries
- Step 7: Set Up Log-Based Alerts
- Integrate with Existing Prometheus + Grafana Stack
- Collecting Docker Container Logs
- Label Design Best Practices
- Common Issues and Quick Fixes
- Next Steps
When an incident happens at 2 AM, the first thing every engineer does is reach for the logs. Scattered log files across /var/log/nginx/, /var/log/syslog, and Docker container logs are difficult to correlate during incident response. Grafana Loki solves this by centralizing all logs into a single queryable interface — and because it’s designed alongside Prometheus, it integrates directly into the same Grafana dashboard as your metrics. One screen for both.
Loki has seen roughly 80% year-over-year growth in adoption through 2025 and into 2026, driven primarily by teams already running Prometheus and Grafana who want a unified observability stack without adding a second complex technology.
What is Grafana Loki and Why It Matters in 2026
Grafana Loki is a horizontally scalable, highly available, multi-tenant log aggregation system inspired by Prometheus. Unlike traditional log management solutions, Loki indexes only a small set of labels (metadata) for each log stream rather than the full text of every log line. The log data itself is compressed and stored in object storage or the local filesystem.
This single design decision — index labels, not log content — is what makes Loki dramatically cheaper to operate than Elasticsearch-based stacks.
How Loki Works: Labels, Not Full-Text Index
Traditional logging systems (Elasticsearch, Splunk) index every word of every log line into a search index. This makes search fast but extremely expensive to store and operate.
Loki takes a different approach:
Traditional (ELK):
  Log line → tokenize every word → full-text index → search
  Storage: large index + log data
  Cost: high (index = 30-50% of raw data size)

Loki approach:
  Log line → attach labels → compress + store chunks → label index only
  Storage: tiny index + compressed chunks
  Cost: 10x-100x cheaper than Elasticsearch
Loki stores logs as compressed chunks in object storage or the local filesystem, indexes only stream labels, and uses LogQL (a query language inspired by PromQL) to filter and aggregate logs at query time rather than index time.
How a log stream works:
Application logs →  labels: {job="nginx", env="prod", host="server1"}
                    log data: "2026-07-15 08:32:11 GET /api/health 200 12ms"
                              "2026-07-15 08:32:12 GET /api/users 500 45ms"
                              ...
Loki stores all log lines with the same label set as a single stream. You query streams using label selectors, then optionally filter the log content within those streams.
Important: Promtail is EOL — Use Grafana Alloy Instead
Promtail reached end-of-life on March 2, 2026. Use Grafana Alloy or another supported client for new production deployments.
If you’ve seen older Loki tutorials using Promtail as the log shipper, those are now outdated. Grafana Alloy is the supported replacement — it’s more powerful (supports metrics, logs, traces, and profiles in one agent), uses a cleaner configuration syntax, and is actively maintained.
Migration from Promtail to Alloy is straightforward — Alloy can read Promtail configuration files directly as a migration path, but new deployments should use native Alloy configuration.
Supported log shippers in 2026:
| Agent | Status | Best for |
|---|---|---|
| Grafana Alloy | ✅ Active (recommended) | New deployments — unified observability agent |
| Promtail | ❌ EOL March 2026 | Legacy — do not use for new setups |
| Fluent Bit | ✅ Active | Kubernetes, resource-constrained environments |
| OpenTelemetry Collector | ✅ Active | Multi-vendor observability pipelines |
| Docker Loki Plugin | ✅ Active | Simple Docker container log forwarding |
Loki vs ELK Stack: When to Use Which
| Grafana Loki | ELK Stack (Elasticsearch) | |
|---|---|---|
| Storage cost | Very low (10x-100x cheaper) | High (full-text index overhead) |
| RAM requirement | 200-400MB (single node) | 4GB+ minimum |
| Setup complexity | Low | High |
| Full-text search | ❌ No (label + filter only) | ✅ Yes |
| Query language | LogQL (similar to PromQL) | Lucene/KQL |
| Grafana integration | ✅ Native | Via plugin |
| Prometheus integration | ✅ Native (same label model) | Via Metricbeat |
| Best for | DevOps teams, Docker/K8s, Prometheus users | Enterprise search, compliance, complex analytics |
Use Loki when: you’re already running Prometheus + Grafana, you want logs and metrics in the same dashboard, or you need cost-effective log storage for high-volume Docker environments.
Use Elasticsearch when: you need full-text search across unstructured logs, complex analytics, or regulatory compliance requiring detailed log indexing.
Architecture Overview
Docker containers / Host logs / Applications
        │
        │ log lines
        ▼
Grafana Alloy (log collector)
  ├── Tails /var/log/* files
  ├── Reads Docker container logs
  └── Attaches labels → pushes to Loki
        │
        │ HTTP push (port 3100)
        ▼
Loki (log storage + query engine)
  ├── Validates labels
  ├── Compresses and stores chunks
  └── Serves LogQL queries
        │
        │ LogQL queries
        ▼
Grafana (visualization + alerts)
  ├── Explore → real-time log search
  ├── Dashboard panels with log panels
  └── Alert rules → Alertmanager
Prerequisites
- Docker and Docker Compose installed — see our Install Docker on Ubuntu 26.04 LTS guide
- If you already have Prometheus + Grafana running, Loki adds to that existing stack — see the integration section
- Minimum 1GB free RAM (Loki is lightweight — 200-400MB)
- Ports 3100 (Loki) available
Project Structure
loki-stack/
├── compose.yml
├── .env
├── loki/
│   └── loki-config.yaml
└── alloy/
    └── config.alloy
mkdir -p ~/loki-stack/{loki,alloy}
cd ~/loki-stackStep 1: Loki Configuration
# loki/loki-config.yaml
auth_enabled: false    # Set to true for multi-tenant deployments

server:
  http_listen_port: 3100
  grpc_listen_port: 9096
  log_level: warn

common:
  path_prefix: /loki
  storage:
    filesystem:
      chunks_directory: /loki/chunks
      rules_directory: /loki/rules
  replication_factor: 1
  ring:
    kvstore:
      store: inmemory

schema_config:
  configs:
    - from: 2024-01-01
      store: tsdb             # TSDB index (recommended since Loki 2.8)
      object_store: filesystem
      schema: v13
      index:
        prefix: loki_index_
        period: 24h

limits_config:
  # Retention: delete logs older than 30 days
  retention_period: 720h      # 30 days
  # Max log line size
  max_line_size: 256KB
  # Reject high-cardinality label sets
  max_label_names_per_series: 15
  max_label_value_length: 2048
  # Query limits
  max_entries_limit_per_query: 5000

compactor:
  working_directory: /loki/compactor
  retention_enabled: true
  retention_delete_delay: 2h

query_range:
  results_cache:
    cache:
      embedded_cache:
        enabled: true
        max_size_mb: 100
Key configuration choices explained:
auth_enabled: false— single-tenant mode, appropriate for most self-hosted setups. Enable for multi-team deployments where log isolation is required.store: tsdb— the modern index format since Loki 2.8, significantly more efficient than the legacyboltdb-shipper.retention_period: 720h— 30 days of log retention. Adjust based on your storage capacity. The compactor runs deletion automatically.
Step 2: Grafana Alloy Configuration
Grafana Alloy uses a configuration language called “River” (.alloy files). This config collects logs from Docker containers and host system logs:
// alloy/config.alloy

// ========================================
// LOKI WRITE ENDPOINT
// ========================================
loki.write "default" {
  endpoint {
    url = "http://loki:3100/loki/api/v1/push"
  }
}

// ========================================
// DOCKER CONTAINER LOGS
// ========================================
discovery.docker "containers" {
  host = "unix:///var/run/docker.sock"
  refresh_interval = "10s"
}

// Relabel Docker metadata into Loki labels
discovery.relabel "docker_labels" {
  targets = discovery.docker.containers.targets

  // Use container name as job label
  rule {
    source_labels = ["__meta_docker_container_name"]
    regex         = "/(.*)"
    target_label  = "container"
  }

  // Use compose service name if available
  rule {
    source_labels = ["__meta_docker_container_label_com_docker_compose_service"]
    target_label  = "service"
  }

  // Keep the image name for context
  rule {
    source_labels = ["__meta_docker_container_image"]
    target_label  = "image"
  }
}

// Scrape Docker container logs
loki.source.docker "docker_logs" {
  host       = "unix:///var/run/docker.sock"
  targets    = discovery.relabel.docker_labels.output
  forward_to = [loki.write.default.receiver]
}

// ========================================
// HOST SYSTEM LOGS
// ========================================

// Syslog
loki.source.file "syslog" {
  targets = [{
    __path__ = "/var/log/syslog",
    job       = "syslog",
    host      = env("HOSTNAME"),
  }]
  forward_to = [loki.write.default.receiver]
}

// Auth log (SSH logins, sudo usage)
loki.source.file "auth_log" {
  targets = [{
    __path__ = "/var/log/auth.log",
    job       = "auth",
    host      = env("HOSTNAME"),
  }]
  forward_to = [loki.write.default.receiver]
}

// UFW firewall logs
loki.source.file "ufw_log" {
  targets = [{
    __path__ = "/var/log/ufw.log",
    job       = "ufw",
    host      = env("HOSTNAME"),
  }]
  forward_to = [loki.write.default.receiver]
}

// ========================================
// NGINX LOGS (if Nginx is running on host)
// ========================================
loki.source.file "nginx_access" {
  targets = [{
    __path__ = "/var/log/nginx/access.log",
    job       = "nginx",
    log_type  = "access",
    host      = env("HOSTNAME"),
  }]
  forward_to = [loki.write.default.receiver]
}

loki.source.file "nginx_error" {
  targets = [{
    __path__ = "/var/log/nginx/error.log",
    job       = "nginx",
    log_type  = "error",
    host      = env("HOSTNAME"),
  }]
  forward_to = [loki.write.default.receiver]
}
Step 3: The Full Docker Compose Stack
.env file:
GRAFANA_ADMIN_PASSWORD=change_this_strong_password
TZ=Asia/Jakarta
# compose.yml
version: '3.8'
networks:
loki-net:
driver: bridge
volumes:
loki-data:
grafana-data:
services:
loki:
image: grafana/loki:3.7.0
container_name: loki
restart: unless-stopped
command: -config.file=/etc/loki/loki-config.yaml
volumes:
- ./loki/loki-config.yaml:/etc/loki/loki-config.yaml:ro
- loki-data:/loki
ports:
- "127.0.0.1:3100:3100" # Bind to localhost only
networks:
- loki-net
healthcheck:
test: ["CMD-SHELL", "wget -qO- http://localhost:3100/ready || exit 1"]
interval: 10s
timeout: 5s
retries: 5
start_period: 30s
alloy:
image: grafana/alloy:v1.16.3
container_name: alloy
restart: unless-stopped
command: run /etc/alloy/config.alloy --server.http.listen-addr=0.0.0.0:12345
volumes:
- ./alloy/config.alloy:/etc/alloy/config.alloy:ro
- /var/log:/var/log:ro # Host system logs
- /var/run/docker.sock:/var/run/docker.sock:ro # Docker container logs
- /var/lib/docker/containers:/var/lib/docker/containers:ro
environment:
HOSTNAME: ${HOSTNAME:-localhost}
depends_on:
loki:
condition: service_healthy
networks:
- loki-net
grafana:
image: grafana/grafana:11.x.x
container_name: grafana-loki
restart: unless-stopped
environment:
GF_SECURITY_ADMIN_PASSWORD: ${GRAFANA_ADMIN_PASSWORD}
GF_USERS_ALLOW_SIGN_UP: "false"
TZ: ${TZ}
volumes:
- grafana-data:/var/lib/grafana
ports:
- "3000:3000"
networks:
- loki-net
depends_on:
loki:
condition: service_healthyNote on Grafana: If you already have Grafana running as part of your Prometheus + Grafana monitoring stack, skip the Grafana service here and instead add Loki as a second data source to your existing Grafana instance. One Grafana for everything — that’s the whole point of the unified stack.
Step 4: Start the Stack and Verify
cd ~/loki-stack
docker compose up -d
docker compose logs -f loki
Wait for Loki ready in the logs, then verify each service:
# Loki ready check
curl -s http://localhost:3100/ready
# Expected: ready

# Check Loki labels (should populate after Alloy starts shipping logs)
curl -s http://localhost:3100/loki/api/v1/labels | jq .

# Check Alloy is running
docker compose logs alloy | tail -20
Step 5: Add Loki as a Data Source in Grafana
- Open Grafana at
http://<server-ip>:3000 - Go to Connections → Data Sources → Add data source
- Select Loki
- Set URL:
http://loki:3100
Critical: Use the Docker service name
lokias the hostname, notlocalhost.When Grafana and Loki run as separate Docker containers,localhostinside the Grafana container refers to the Grafana container itself, not the host machine or the Loki container.This is the most common misconfiguration for new users.
- Click Save & Test — you should see “Data source connected and labels found”
Step 6: Writing LogQL Queries
LogQL uses stream selectors in curly braces to filter log streams — for example {job="nginx", env="prod"} — then optionally adds pipe expressions for filtering, parsing, and metric queries.
Basic log stream queries:
# All logs from a specific job
{job="nginx"}

# All Docker container logs
{job="docker"}

# Specific container by name
{container="redis"}

# All logs containing "error" (case-sensitive)
{job="nginx"} |= "error"

# Case-insensitive search
{job="nginx"} |~ "(?i)error"

# Exclude patterns (remove health check noise)
{job="nginx"} != "GET /health"

# Multiple label selectors
{job="nginx", host="server1"}
Parse structured logs:
# Parse JSON logs and filter by field
{container="myapp"} | json | level="error"

# Parse logfmt format
{job="auth"} | logfmt | action="Failed password"

# Extract fields with regex
{job="nginx"} | regexp `(?P<method>\w+) (?P<path>\S+) HTTP/\d\.\d" (?P<status>\d+)`
| status = "500"
Practical queries for your infrastructure:
# SSH failed login attempts
{job="auth"} |= "Failed password"

# UFW firewall blocks
{job="ufw"} |= "UFW BLOCK"

# HTTP 5xx errors from Nginx
{job="nginx", log_type="access"} |= '" 5'

# Docker container crashes (OOM kills)
{job="syslog"} |= "Killed process"

# Redis errors from Docker containers
{container="redis"} |= "ERROR"

# MongoDB connection issues
{container="mongodb"} |= "connection refused"
Metric queries (LogQL → time series):
# Error rate per minute (for Grafana graph panel)
rate({job="nginx"} |= "error" [1m])

# Count of 500 errors over time
count_over_time({job="nginx"} |= '" 500' [5m])

# Top containers by log volume
topk(5, sum by (container) (rate({job="docker"}[5m])))

# SSH login attempts per minute
rate({job="auth"} |= "Failed password" [1m])
Step 7: Set Up Log-Based Alerts
In Grafana: Alerting → Alert Rules → New alert rule
Alert: High error rate in Nginx:
# Alert expression — fires when more than 10 errors/min
sum(rate({job="nginx"} |= "error" [5m])) > 0.17
Configuration:
- Name: High Nginx Error Rate
- Condition: above 0.17 (= 10 errors per minute)
- Pending period: 2m (must persist for 2 minutes before firing)
- Contact point: Slack, email, or webhook
Alert: SSH brute force detection:
sum(count_over_time({job="auth"} |= "Failed password" [5m])) > 20Fires when more than 20 failed SSH login attempts occur in 5 minutes — a common brute force pattern.
Alert: Container crash loop:
count_over_time({job="syslog"} |= "Killed process" [10m]) > 3Integrate with Existing Prometheus + Grafana Stack
If you already have the Prometheus + Grafana monitoring stack running, integrate Loki into it rather than running a separate Grafana:
1. Connect Loki to the existing monitoring network:
Add to your Loki compose.yml:
networks:
  loki-net:
    driver: bridge
  monitoring:
    external: true    # Join the existing Prometheus+Grafana network
Add monitoring network to the loki service:
services:
  loki:
    networks:
      - loki-net
      - monitoring    # Reachable from existing Grafana
2. Add Loki as a data source in your existing Grafana:
- Go to Connections → Data Sources → Add → Loki
- URL:
http://loki:3100 - Save & Test
3. Create a unified dashboard with both Prometheus metrics and Loki logs side by side:
In any Grafana dashboard panel: set data source to Loki and use a Logs panel type. Place it next to your existing Prometheus metric graphs. When you see a CPU spike at 14:32, you can immediately look at the log panel for the same time range and see what was happening.
4. Add Alloy to scrape Prometheus metrics too:
Alloy can collect both logs (for Loki) AND metrics (for Prometheus) in a single agent:
// Add to config.alloy — scrape Prometheus metrics too
prometheus.scrape "node" {
  targets = [{"__address__" = "node-exporter:9100"}]
  forward_to = [prometheus.remote_write.mimir.receiver]
}
Collecting Docker Container Logs
The Alloy configuration above auto-discovers Docker containers via the Docker socket. Every container’s logs are immediately available in Grafana under the container label.
For services like Redis and MongoDB from our earlier guides:
# Redis logs — monitor maxmemory warnings
{container="redis"} |= "WARNING"

# MongoDB replica set status changes
{container="mongodb"} |= "PRIMARY"

# Any OOM (out-of-memory) kills affecting containers
{job="syslog"} |= "oom-kill"
This pairs directly with the metrics from your Prometheus + Grafana monitoring stack — if you see a Redis memory metric spike, switch to the Loki panel for the same timestamp and see the exact warning messages that preceded it.
Label Design Best Practices
Labels are the most important design decision in a Loki deployment. Poor label design leads to high cardinality (too many streams) which degrades performance.
Good label candidates: app, env (production/staging), host, namespace, pod, level (info/warn/error). Bad labels: user IDs, request IDs, timestamps, or any value that is unique per log line.
✅ Good labels (low cardinality — few unique values):
  job="nginx"
  env="production"
  host="server1"
  level="error"

❌ Bad labels (high cardinality — millions of unique values):
  request_id="abc123def456"    ← unique per request
  user_id="12345"              ← unique per user
  timestamp="2026-07-15..."    ← never repeat this
  ip="192.168.1.100"           ← too many unique IPs
Rule of thumb: If a label value can be one of millions of unique values, it’s not a label — it’s log content. Keep it in the log line itself and filter it with |= or | json.
Common Issues and Quick Fixes
| Symptom | Likely Cause | Fix |
|---|---|---|
| “Data source connected” but no labels in Grafana | Alloy not yet shipping logs | Wait 30-60 seconds; check docker compose logs alloy for errors |
http://localhost:3100 not working from Grafana | Using localhost instead of service name | Change to http://loki:3100 in the Grafana data source config |
| Loki returns “too many outstanding requests” | Query hits concurrency limit | Increase max_query_parallelism in loki-config or reduce dashboard panel count |
| Alloy can’t read Docker logs | /var/run/docker.sock not mounted | Ensure - /var/run/docker.sock:/var/run/docker.sock:ro is in Alloy volumes |
| Loki disk growing too fast | Retention not configured | Add retention_period to limits_config and enable compactor |
| High cardinality warning in Loki logs | Too many unique label combinations | Audit your Alloy config; remove high-cardinality labels from relabeling rules |
| Missing auth.log or syslog entries | File permissions | Run Alloy container as root or adjust file permissions on /var/log |
Next Steps
With Grafana Loki running alongside your infrastructure:
- Unified observability — add Loki as a second data source in your Prometheus + Grafana monitoring stack to get metrics and logs in a single dashboard
- Security monitoring — create dashboards tracking SSH brute force attempts, UFW blocks, and failed authentication events using the LogQL queries in this guide
- Application log parsing — extend the Alloy config to parse structured JSON logs from your Redis and MongoDB containers with the
| jsonpipe expression - Log-based alerting — configure Grafana alerts using the LogQL metric queries from Step 7, and route notifications to Slack or email via the Alertmanager setup in the Prometheus + Grafana guide
- Harden the stack — follow the Docker Container Security Best Practices guide to ensure Loki’s port 3100 is not exposed to the internet and Docker socket access is appropriately restricted
Related posts:
 How to Set Up Prometheus and Grafana Monitoring Stack with Docker Compose
 How To Install Grafana on Ubuntu 20.04 LTS
 How to install Prometheus on Centos 8
 How To Install Prometheus on Debian 11
 Getting Started with ManageEngine, Powerful Monitoring Tools
 How to Install Monitorix on CentOS Stream 10 (Step-by-Step Guide)
 Datadog: The Complete Guide to Modern Monitoring and Observability (2025 Edition)
 How to Install Datadog on CentOS Stream 10 — Step-by-Step Guide
