How to Set Up Prometheus and Grafana Monitoring Stack with Docker Compose

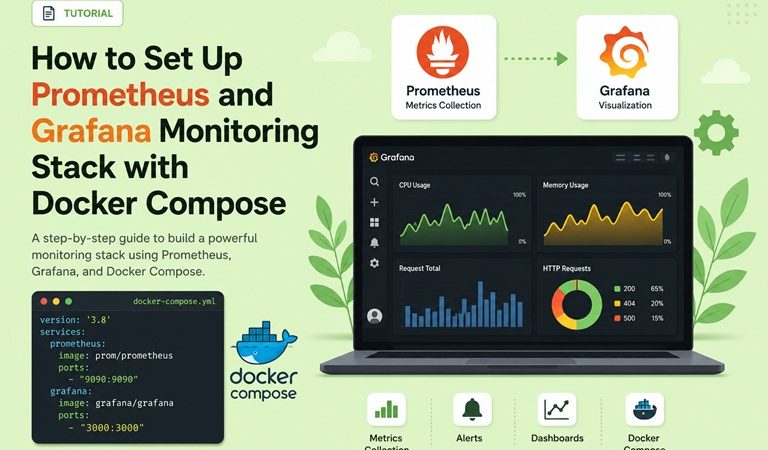
Table of Contents
- What You’re Building
- How Prometheus and Grafana Work Together
- Prerequisites
- Project Structure
- Step 1: Prometheus Configuration
- Step 2: Alert Rules
- Step 3: Alertmanager Configuration
- Step 4: Grafana Auto-Provisioning
- Step 5: The Full Docker Compose Stack
- Step 6: Start the Stack and Verify
- Step 7: Importing Your First Dashboard
- Step 8: Writing Your First PromQL Query
- Monitoring Docker Containers with cAdvisor
- Production Hardening Checklist
- Common Issues and Quick Fixes
- Next Steps
Most infrastructure problems don’t announce themselves — they build up quietly until something breaks. A server runs out of disk space at 3 AM. A container silently restarts 50 times in an hour. Memory creeps toward its limit over three days before everything grinds to a halt. The difference between catching these early and waking up to an outage is a monitoring stack that’s actually watching.
Prometheus collects and stores metrics from your infrastructure. Grafana turns those metrics into dashboards and alerts you can actually act on. Together with Node Exporter (host metrics) and Alertmanager (notifications), they form the standard open-source observability stack used by teams ranging from small self-hosted setups to large-scale production environments.
This guide builds the full stack with Docker Compose — Prometheus, Grafana, Node Exporter, cAdvisor, and Alertmanager — with auto-provisioning, persistent storage, and a production hardening checklist.
What You’re Building
By the end of this guide, you’ll have:
- Prometheus scraping metrics every 15 seconds from all services
- Node Exporter exposing host-level metrics (CPU, memory, disk, network)
- cAdvisor exposing per-container Docker metrics
- Grafana with Prometheus auto-configured as a data source and pre-loaded dashboards
- Alertmanager sending notifications when something goes wrong
- Everything persisted in named volumes and isolated on a dedicated Docker network
How Prometheus and Grafana Work Together
Understanding the data flow makes troubleshooting much easier:
Host OS / Docker containers
        │
        │ expose metrics endpoints
        ▼
Node Exporter (:9100) + cAdvisor (:8080)
        │
        │ Prometheus pulls (scrapes) every 15s
        ▼
Prometheus (:9090) ──── stores TSDB on disk
        │
        │ Grafana queries via PromQL
        ▼
Grafana (:3000) ──── dashboards + alerts
        │
        │ fires alert rules → Alertmanager
        ▼
Alertmanager (:9093) ──── sends to Slack/email/PagerDuty
The critical concept: Prometheus is pull-based, not push-based. Prometheus reaches out to each target and scrapes its /metrics endpoint on a schedule. Services don’t push data to Prometheus — they expose an HTTP endpoint and wait for Prometheus to come collect. This pull model makes it easy to add or remove monitoring targets without touching the monitored service.
Prerequisites
- Docker and Docker Compose installed (see our Install Docker on Ubuntu 26.04 LTS guide)
- At least 2GB of free RAM (Prometheus TSDB is memory-hungry under load)
- A server or VM you want to monitor
Project Structure
monitoring-stack/
├── compose.yml
├── .env
├── prometheus/
│   ├── prometheus.yml
│   └── alert.rules.yml
├── alertmanager/
│   └── alertmanager.yml
└── grafana/
    └── provisioning/
        ├── datasources/
        │   └── datasource.yml
        └── dashboards/
            └── dashboards.yml
Create the directory structure:
mkdir -p ~/monitoring-stack/{prometheus,alertmanager,grafana/provisioning/{datasources,dashboards}}
cd ~/monitoring-stack
Step 1: Prometheus Configuration
# prometheus/prometheus.yml
global:
  scrape_interval: 15s
  evaluation_interval: 15s
  external_labels:
    monitor: 'bckinfo-monitoring'

alerting:
  alertmanagers:
    - static_configs:
        - targets:
            - alertmanager:9093

rule_files:
  - /etc/prometheus/alert.rules.yml

scrape_configs:
  # Prometheus self-monitoring
  - job_name: 'prometheus'
    static_configs:
      - targets: ['prometheus:9090']

  # Host metrics via Node Exporter
  - job_name: 'node-exporter'
    static_configs:
      - targets: ['node-exporter:9100']

  # Docker container metrics via cAdvisor
  - job_name: 'cadvisor'
    static_configs:
      - targets: ['cadvisor:8080']
Each job_name in scrape_configs corresponds to a service in the Compose stack. The hostnames (like node-exporter, cadvisor) are Docker service names resolved over the shared monitoring network — the same hostname-as-service-name pattern used in our Redis with Docker Compose and MongoDB with Docker Compose guides.
Step 2: Alert Rules
# prometheus/alert.rules.yml
groups:
  - name: host-alerts
    interval: 30s
    rules:
      # Alert when any scrape target is down
      - alert: TargetDown
        expr: up == 0
        for: 2m
        labels:
          severity: critical
        annotations:
          summary: "Target {{ $labels.job }} is down"
          description: "{{ $labels.instance }} has been unreachable for more than 2 minutes."

      # Alert when CPU usage > 85% for 5 minutes
      - alert: HighCpuUsage
        expr: 100 - (avg by(instance) (rate(node_cpu_seconds_total{mode="idle"}[5m])) * 100) > 85
        for: 5m
        labels:
          severity: warning
        annotations:
          summary: "High CPU usage on {{ $labels.instance }}"
          description: "CPU usage is above 85% for more than 5 minutes. Current value: {{ $value | printf \"%.1f\" }}%"

      # Alert when memory usage > 90%
      - alert: HighMemoryUsage
        expr: (1 - (node_memory_MemAvailable_bytes / node_memory_MemTotal_bytes)) * 100 > 90
        for: 5m
        labels:
          severity: warning
        annotations:
          summary: "High memory usage on {{ $labels.instance }}"
          description: "Memory usage is above 90%. Current value: {{ $value | printf \"%.1f\" }}%"

      # Alert when disk usage > 85%
      - alert: DiskSpaceRunningLow
        expr: (1 - (node_filesystem_avail_bytes{fstype!~"tmpfs|fuse.lxcfs"} / node_filesystem_size_bytes)) * 100 > 85
        for: 5m
        labels:
          severity: warning
        annotations:
          summary: "Disk space low on {{ $labels.instance }}"
          description: "Filesystem {{ $labels.mountpoint }} is {{ $value | printf \"%.1f\" }}% full."

      # Alert when disk will be full in less than 24 hours
      - alert: DiskWillFillIn24Hours
        expr: predict_linear(node_filesystem_avail_bytes{fstype!~"tmpfs"}[6h], 24 * 3600) < 0
        for: 30m
        labels:
          severity: critical
        annotations:
          summary: "Disk will fill in 24 hours on {{ $labels.instance }}"
          description: "Filesystem {{ $labels.mountpoint }} is predicted to fill within 24 hours."
predict_linear in the last rule is one of Prometheus’s most useful functions — it projects the current trajectory of a metric forward in time, letting you alert on trends before they become crises.
Step 3: Alertmanager Configuration
# alertmanager/alertmanager.yml
global:
  resolve_timeout: 5m
  slack_api_url: '${SLACK_WEBHOOK_URL}'

route:
  group_by: ['alertname', 'instance']
  group_wait: 30s
  group_interval: 5m
  repeat_interval: 4h
  receiver: 'slack-notifications'
  routes:
    - match:
        severity: critical
      receiver: 'slack-notifications'
      repeat_interval: 1h

receivers:
  - name: 'slack-notifications'
    slack_configs:
      - channel: '#alerts'
        title: '{{ if eq .Status "firing" }}🔥 FIRING{{ else }}✅ RESOLVED{{ end }}: {{ .GroupLabels.alertname }}'
        text: >-
          {{ range .Alerts }}
          *Alert:* {{ .Annotations.summary }}
          *Description:* {{ .Annotations.description }}
          *Severity:* {{ .Labels.severity }}
          {{ end }}
        send_resolved: true

inhibit_rules:
  - source_match:
      severity: 'critical'
    target_match:
      severity: 'warning'
    equal: ['alertname', 'instance']
The inhibit_rules section prevents alert storms — if a critical alert fires for an instance, Prometheus suppresses the warning-level alerts for that same instance. This keeps your Slack channel from flooding with redundant notifications when a server goes down.
If you don’t use Slack, Alertmanager also supports email, PagerDuty, OpsGenie, and webhooks — swap the receivers section accordingly.
Step 4: Grafana Auto-Provisioning
Instead of manually adding Prometheus as a data source in the Grafana UI every time you deploy, use provisioning files to configure it automatically at startup.
# grafana/provisioning/datasources/datasource.yml
apiVersion: 1

datasources:
  - name: Prometheus
    type: prometheus
    access: proxy
    url: http://prometheus:9090
    isDefault: true
    editable: false
# grafana/provisioning/dashboards/dashboards.yml
apiVersion: 1
providers:
- name: 'default'
orgId: 1
folder: ''
type: file
disableDeletion: false
updateIntervalSeconds: 10
allowUiUpdates: true
options:
path: /var/lib/grafana/dashboardsThis is the same one-shot initialization approach used for MongoDB replica sets and Apache Superset — configuration that runs once at startup, making the deployment fully repeatable.
Step 5: The Full Docker Compose Stack
.env file first:
GRAFANA_ADMIN_USER=admin
GRAFANA_ADMIN_PASSWORD=change_this_strong_password
SLACK_WEBHOOK_URL=https://hooks.slack.com/services/YOUR/WEBHOOK/URL
# compose.yml
version: '3.8'
networks:
monitoring:
driver: bridge
volumes:
prometheus-data:
grafana-data:
services:
prometheus:
image: prom/prometheus:latest
container_name: prometheus
restart: unless-stopped
command:
- '--config.file=/etc/prometheus/prometheus.yml'
- '--storage.tsdb.path=/prometheus'
- '--storage.tsdb.retention.time=30d'
- '--web.enable-lifecycle'
- '--web.enable-admin-api'
volumes:
- ./prometheus/prometheus.yml:/etc/prometheus/prometheus.yml:ro
- ./prometheus/alert.rules.yml:/etc/prometheus/alert.rules.yml:ro
- prometheus-data:/prometheus
ports:
- "127.0.0.1:9090:9090"
networks:
- monitoring
healthcheck:
test: ["CMD", "wget", "-qO-", "http://localhost:9090/-/ready"]
interval: 15s
timeout: 5s
retries: 5
grafana:
image: grafana/grafana:latest
container_name: grafana
restart: unless-stopped
environment:
- GF_SECURITY_ADMIN_USER=${GRAFANA_ADMIN_USER}
- GF_SECURITY_ADMIN_PASSWORD=${GRAFANA_ADMIN_PASSWORD}
- GF_USERS_ALLOW_SIGN_UP=false
- GF_SERVER_DOMAIN=localhost
- GF_SMTP_ENABLED=false
volumes:
- grafana-data:/var/lib/grafana
- ./grafana/provisioning:/etc/grafana/provisioning:ro
ports:
- "3000:3000"
networks:
- monitoring
depends_on:
prometheus:
condition: service_healthy
node-exporter:
image: prom/node-exporter:latest
container_name: node-exporter
restart: unless-stopped
command:
- '--path.procfs=/host/proc'
- '--path.sysfs=/host/sys'
- '--path.rootfs=/rootfs'
- '--collector.filesystem.mount-points-exclude=^/(sys|proc|dev|host|etc)($$|/)'
volumes:
- /proc:/host/proc:ro
- /sys:/host/sys:ro
- /:/rootfs:ro
ports:
- "127.0.0.1:9100:9100"
networks:
- monitoring
cadvisor:
image: gcr.io/cadvisor/cadvisor:latest
container_name: cadvisor
restart: unless-stopped
privileged: true
volumes:
- /:/rootfs:ro
- /var/run:/var/run:ro
- /sys:/sys:ro
- /var/lib/docker/:/var/lib/docker:ro
- /dev/disk/:/dev/disk:ro
ports:
- "127.0.0.1:8080:8080"
networks:
- monitoring
alertmanager:
image: prom/alertmanager:latest
container_name: alertmanager
restart: unless-stopped
command:
- '--config.file=/etc/alertmanager/alertmanager.yml'
- '--storage.path=/alertmanager'
environment:
- SLACK_WEBHOOK_URL=${SLACK_WEBHOOK_URL}
volumes:
- ./alertmanager/alertmanager.yml:/etc/alertmanager/alertmanager.yml:ro
ports:
- "127.0.0.1:9093:9093"
networks:
- monitoringTwo security decisions in this Compose file worth calling out explicitly:
- Port bindings use
127.0.0.1:for Prometheus, Node Exporter, cAdvisor, and Alertmanager. This means those services are only reachable from the server itself — not exposed to the network. Only Grafana (port 3000) is accessible externally, since that’s the only interface end users need. This follows the same network isolation principle covered in our Docker Container Security Best Practices guide. GF_USERS_ALLOW_SIGN_UP=false— prevents anyone from self-registering an account on your Grafana instance.
Step 6: Start the Stack and Verify
cd ~/monitoring-stack
docker compose up -d
Watch services come up:
docker compose ps
docker compose logs -f prometheus
Verify each service is reachable:
# Prometheus ready check
curl -s http://localhost:9090/-/ready
# Expected: "Prometheus Server is Ready."

# Node Exporter metrics check
curl -s http://localhost:9100/metrics | head -20

# Grafana health check
curl -s http://localhost:3000/api/health
# Expected: {"commit":"...","database":"ok","version":"..."}
Open http://<your-server-ip>:3000 in a browser and log in with the credentials from your .env file.
Step 7: Importing Your First Dashboard
Grafana has thousands of community-built dashboards at grafana.com/grafana/dashboards. The most useful ones for a server monitoring stack:
Node Exporter Full — Dashboard ID: 1860
The gold standard for host metrics — CPU, memory, disk I/O, network, load average, all in one view.
To import: Dashboards → Import → Enter ID 1860 → Load → select your Prometheus data source → Import.
Docker and Container Metrics — Dashboard ID: 193
Container CPU, memory, and network stats from cAdvisor, with per-container breakdown.
Prometheus 2.0 Stats — Dashboard ID: 3662
Self-monitoring for Prometheus itself — scrape durations, TSDB metrics, sample ingestion rate.
Step 8: Writing Your First PromQL Query
Prometheus Query Language (PromQL) is what Grafana uses to pull data from Prometheus. A few practical queries to get started:
# Current CPU usage percentage (all cores, 5-minute average)
100 - (avg by(instance) (rate(node_cpu_seconds_total{mode="idle"}[5m])) * 100)

# Available memory in GB
node_memory_MemAvailable_bytes / 1024 / 1024 / 1024

# Disk usage percentage per filesystem
(1 - (node_filesystem_avail_bytes / node_filesystem_size_bytes)) * 100

# Number of running Docker containers
count(container_last_seen{image!=""})

# Container CPU usage rate (specific container by name)
rate(container_cpu_usage_seconds_total{name="redis"}[5m]) * 100

# HTTP request rate per second
rate(prometheus_http_requests_total[5m])
In Grafana, go to Explore (compass icon in the left sidebar), select your Prometheus data source, paste any query above into the metrics input, and click Run Query to see results immediately.
Monitoring Docker Containers with cAdvisor
cAdvisor (Container Advisor) automatically discovers all running containers on the Docker host and exposes their resource usage as Prometheus metrics — no per-container configuration required.
The metrics cAdvisor provides include:
| Metric | What it measures |
|---|---|
container_cpu_usage_seconds_total | Cumulative CPU time consumed |
container_memory_usage_bytes | Current memory usage |
container_memory_limit_bytes | Memory limit set on container |
container_network_transmit_bytes_total | Network bytes sent |
container_network_receive_bytes_total | Network bytes received |
container_fs_reads_bytes_total | Filesystem read bytes |
For containers running Redis or MongoDB (see our Redis and MongoDB guides), cAdvisor gives you memory and CPU visibility without any instrumentation changes to those containers — you can immediately see if Redis is approaching its maxmemory limit or if a MongoDB container is consuming unexpectedly high CPU.
Production Hardening Checklist
Before this stack serves real infrastructure:
- Put Grafana behind a reverse proxy with TLS. Port 3000 over plain HTTP is fine for a local lab, not for anything reachable from the internet. Nginx or Traefik with Let’s Encrypt handles termination cleanly.
- Change the default Grafana admin password from what’s in
.env— and rotate it from the CLI, not the UI, on first login. - Set a Prometheus retention period matching your storage capacity.
--storage.tsdb.retention.time=30dis a reasonable default; 90 days gives you better trend visibility but needs more disk. - Add resource limits to the Compose file — Prometheus and Grafana can consume significant memory under load. Cap them with
deploy.resources.limitsto prevent a noisy monitoring stack from affecting the services it’s monitoring. - Back up the Grafana volume — this is where your dashboards, saved queries, and alert configurations live. A volume backup on a schedule (same approach as the Redis backup scripts guide) prevents losing custom dashboards when the host is rebuilt.
- Restrict Prometheus and Alertmanager access — in this guide both are already bound to
127.0.0.1. Keep it that way. If you need remote access, use an SSH tunnel or VPN rather than opening those ports.
Common Issues and Quick Fixes
| Symptom | Likely Cause | Fix |
|---|---|---|
Prometheus shows target as DOWN | Node Exporter/cAdvisor not reachable on monitoring network | Confirm all services are on the same monitoring network; check docker compose ps |
| No data in Grafana dashboards | Wrong data source URL or Prometheus not ready | Verify http://prometheus:9090 is set in the data source, not http://localhost:9090 |
| cAdvisor container fails to start | Missing privileged: true or host volume permissions | Ensure privileged: true is set in the cAdvisor service definition |
| Alerts firing continuously without resolution | resolve_timeout too short, or condition never clears | Increase resolve_timeout in Alertmanager; verify the alert condition logic |
| Prometheus disk usage grows too fast | Retention period too long, or too many high-cardinality labels | Lower --storage.tsdb.retention.time, audit your scrape configs for label explosion |
| Grafana login shows “invalid username or password” | .env not loaded, or password has special characters breaking YAML | Wrap the password in quotes in .env; verify docker compose config shows the correct values |
Next Steps
With Prometheus and Grafana running, you can extend the stack by adding exporters for the specific services in your infrastructure:
- Redis Exporter (
oliver006/redis_exporter) — see this alongside our Redis with Docker Compose guide for memory usage, keyspace hits, and eviction rates per Redis instance. - MongoDB Exporter (
percona/mongodb_exporter) — pairs with our MongoDB with Docker Compose guide for replica set health, connection pool, and oplog metrics. - Blackbox Exporter — probe external HTTP endpoints, DNS, and TCP ports from Prometheus, turning it into an uptime monitor for services outside the Docker host.
- Grafana Loki — add centralized log aggregation to this stack. Loki stores logs in the same way Prometheus stores metrics, and Grafana visualizes both in the same dashboard — one pane of glass for metrics and logs simultaneously.
Related posts:
 How to install Prometheus on Centos 8
 How To Install Grafana on Ubuntu 20.04 LTS
 How To Install Prometheus on Debian 11
 Docker Compose Security: Complete Hardening Guide for 2026
 MongoDB with Docker Compose: Authentication, Replica Set, and Production-Ready Setup
 How to Install Docker and Docker Compose on Ubuntu 26.04 LTS
 How To Install Docker On Ubuntu 22.04
 Run Redis in Docker: Complete Setup Guide 2026
