Installing Metrics Server on Kubernetes: Complete Setup and Troubleshooting Guide

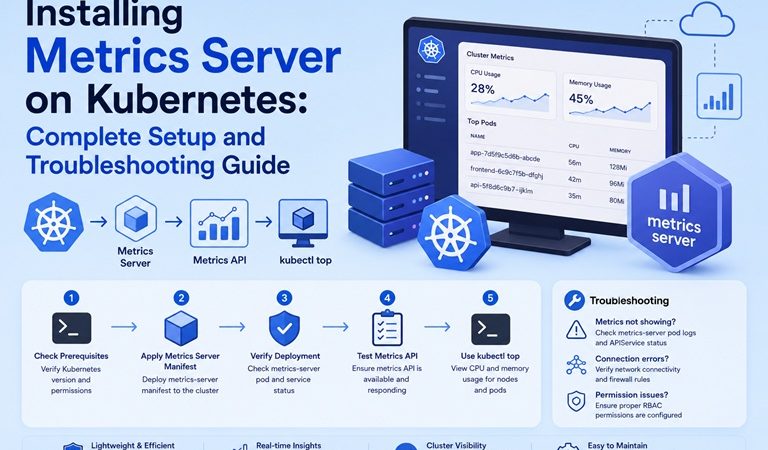
Metrics Server is the component that powers kubectl top, the Horizontal Pod Autoscaler (HPA), and the Vertical Pod Autoscaler (VPA) recommender. Without it, resource-based autoscaling simply doesn’t work — HPA objects sit with <unknown> targets and never scale. This guide covers a full production install: manifest deployment, TLS/kubelet certificate troubleshooting (the single most common failure mode), high availability, and verification against real workloads.
If you’ve already built an HPA-driven deployment and it isn’t scaling, this is almost always the missing piece — see the companion guide on Horizontal Pod Autoscaler (HPA) in Kubernetes for the autoscaler side of this pairing.
Table of Contents
- What Metrics Server Does (and Doesn’t Do)
- Architecture
- Prerequisites
- Standard Installation
- Installation on kubeadm Clusters (TLS Fix)
- Installation via Helm
- High Availability Configuration
- Verifying the Installation
- Comparison: Metrics Server vs Prometheus vs kube-state-metrics
- Troubleshooting
- FAQ
1. What Metrics Server Does (and Doesn’t Do)
Metrics Server is a cluster-wide aggregator of resource usage data. It collects CPU and memory metrics from each node’s kubelet (via the Summary API) and exposes them through the Kubernetes Resource Metrics API (metrics.k8s.io). Three things consume this API:
kubectl top nodes/kubectl top pods- Horizontal Pod Autoscaler (CPU/memory-based scaling)
- Vertical Pod Autoscaler recommender
What it is not: a monitoring or alerting system. It holds no history — only the most recent snapshot — and is not a substitute for Prometheus. Use it for autoscaling decisions and quick kubectl top checks; use Prometheus/Grafana for dashboards, alerting, and long-term trend analysis (see Prometheus and Grafana installation guide).
2. Architecture
┌─────────────────────────────────────────────────────────────────┐
│                       METRICS SERVER FLOW                       │
├─────────────────────────────────────────────────────────────────┤
│  Node 1                Node 2                Node 3             │
│  ┌─────────┐           ┌─────────┐           ┌─────────┐        │
│  │ kubelet │           │ kubelet │           │ kubelet │        │
│  │ /stats/ │           │ /stats/ │           │ /stats/ │        │
│  │ summary │           │ summary │           │ summary │        │
│  └────┬────┘           └────┬────┘           └────┬────┘        │
│       │  HTTPS :10250       │                     │             │
│       └──────────────┬──────┴─────────────────────┘             │
│                       ▼                                         │
│            ┌─────────────────────┐                              │
│            │   Metrics Server    │(scrapes every 15s by default)│
│            │   Deployment        │                              │
│            └──────────┬──────────┘                              │
│                       │ registers                               │
│                       ▼                                         │
│            ┌─────────────────────┐                              │
│            │  metrics.k8s.io     │APIService (aggregation layer)│
│            │  Resource Metrics   │                              │
│            │  API                │                              │
│            └──────────┬──────────┘                              │
│                       │                                         │
│         ┌─────────────┼─────────────┐                           │
│         ▼             ▼             ▼                           │
│   kubectl top     HPA Controller  VPA Recommender               │
└─────────────────────────────────────────────────────────────────┘
3. Prerequisites
- A working Kubernetes cluster (1.28+) with
kubectlaccess - Cluster DNS functioning (CoreDNS reachable)
- Network connectivity from control plane to kubelets on port
10250 - Managed clusters (EKS, GKE, AKS) usually need no additional TLS flags; self-hosted kubeadm clusters almost always do (Section 5)
4. Standard Installation
Apply the official manifest directly:
kubectl apply -f https://github.com/kubernetes-sigs/metrics-server/releases/latest/download/components.yamlCheck rollout status:
kubectl rollout status deployment/metrics-server -n kube-systemOn managed Kubernetes (EKS, GKE, AKS), this is frequently all that’s required. On self-hosted clusters — kubeadm, k3s with custom CNI, bare-metal — you will very likely hit a TLS certificate error at this point. Continue to Section 5.
5. Installation on kubeadm Clusters (TLS Fix)
The most common failure is Metrics Server being unable to verify the kubelet’s serving certificate, because kubeadm clusters typically issue self-signed kubelet certs not signed by a CA Metrics Server trusts. Symptom:
kubectl logs -n kube-system deploy/metrics-server
# x509: cannot validate certificate for <node-ip> because it doesn't contain any IP SANs
Fix by patching the Metrics Server Deployment to skip kubelet TLS verification (acceptable for most self-hosted clusters; for stricter environments, issue proper kubelet serving certs instead):
kubectl patch deployment metrics-server -n kube-system --type='json' \
  -p='[{"op":"add","path":"/spec/template/spec/containers/0/args/-","value":"--kubelet-insecure-tls"}]'
Equivalent manifest edit:
# components.yaml (excerpt)
spec:
  template:
    spec:
      containers:
        - name: metrics-server
          args:
            - --cert-dir=/tmp
            - --secure-port=4443
            - --kubelet-preferred-address-types=InternalIP,ExternalIP,Hostname
            - --kubelet-use-node-status-port
            - --metric-resolution=15s
            - --kubelet-insecure-tls
If you’d rather avoid --kubelet-insecure-tls in production, issue kubelet serving certificates signed by the cluster CA and enable certificate rotation:
# On each node's kubelet config
--rotate-server-certificates=true
--tls-cert-file=/var/lib/kubelet/pki/kubelet.crt
--tls-private-key-file=/var/lib/kubelet/pki/kubelet.key
Then approve pending CSRs:
kubectl get csr
kubectl certificate approve <csr-name>
6. Installation via Helm
helm repo add metrics-server https://kubernetes-sigs.github.io/metrics-server/
helm repo update

helm install metrics-server metrics-server/metrics-server \
  --namespace kube-system \
  --set args="{--kubelet-insecure-tls}" \
  --set resources.requests.cpu=100m \
  --set resources.requests.memory=200Mi
7. High Availability Configuration
For production clusters, run Metrics Server with multiple replicas and pod anti-affinity so a single node failure doesn’t blind the autoscaler:
apiVersion: apps/v1
kind: Deployment
metadata:
  name: metrics-server
  namespace: kube-system
spec:
  replicas: 2
  template:
    spec:
      affinity:
        podAntiAffinity:
          requiredDuringSchedulingIgnoredDuringExecution:
            - labelSelector:
                matchLabels:
                  k8s-app: metrics-server
              topologyKey: kubernetes.io/hostname
      containers:
        - name: metrics-server
          resources:
            requests:
              cpu: 100m
              memory: 200Mi
            limits:
              memory: 400Mi
8. Verifying the Installation
# Check the APIService is available
kubectl get apiservices | grep metrics.k8s.io
# v1beta1.metrics.k8s.io   kube-system/metrics-server   True

# Node-level metrics
kubectl top nodes

# Pod-level metrics across all namespaces
kubectl top pods -A

# Confirm HPA can now read metrics (was previously <unknown>)
kubectl get hpa -A
Expected kubectl top nodes output:
NAME           CPU(cores)   CPU%   MEMORY(bytes)   MEMORY%
node-1         340m         17%    2100Mi           54%
node-2         290m         14%    1850Mi           47%
node-3         410m         20%    2400Mi           61%
9. Comparison: Metrics Server vs Prometheus vs kube-state-metrics
| Tool | Purpose | Data Retention | Powers HPA? | Powers Dashboards/Alerts? |
|---|---|---|---|---|
| Metrics Server | Real-time CPU/memory snapshot | None (current only) | Yes | No |
| Prometheus | Time-series metrics collection | Configurable (days–months) | Only with Prometheus Adapter | Yes |
| kube-state-metrics | Kubernetes object state (not resource usage) | None (exposes current state) | No | Yes, paired with Prometheus |
10. Troubleshooting
| Symptom | Likely Cause | Fix |
|---|---|---|
error: Metrics API not available | Metrics Server not running or APIService not registered | kubectl get pods -n kube-system | grep metrics-server; check logs |
x509: cannot validate certificate in logs | kubelet cert not signed by trusted CA (common on kubeadm) | Add --kubelet-insecure-tls, or issue proper kubelet serving certs |
kubectl top pods returns no data for some pods | Pod just started; metrics not yet scraped | Wait one scrape interval (default 15s–60s) |
HPA shows <unknown> under TARGETS | Metrics Server unreachable or resource requests not set on pods | Verify Metrics Server health; ensure resources.requests is defined on target containers |
| Metrics Server CrashLoopBackOff | Insufficient memory limit for cluster size | Raise resources.limits.memory in the Deployment |
| Works in one namespace but not another | NetworkPolicy blocking Metrics Server egress to kubelets | Allow egress on port 10250 from the kube-system Metrics Server pod |
| Metrics lag significantly behind real usage | --metric-resolution set too high | Lower to 15s (default), balancing against API server load |
11. FAQ
Does Metrics Server work out of the box on EKS/GKE/AKS?
Usually yes on GKE and AKS. EKS often needs the standard manifest applied manually since it isn’t installed by default, but rarely needs the insecure-TLS flag since kubelet certs are properly signed.
Is --kubelet-insecure-tls safe for production?
It disables verification of the kubelet’s serving certificate, which is an acceptable trade-off on many self-hosted clusters where the kubelet is already only reachable within a trusted network. For stricter security postures, issue and rotate proper kubelet serving certificates instead.
Why does HPA still show <unknown> after installing Metrics Server?
The most common cause besides Metrics Server itself is missing resources.requests on the target deployment’s containers — HPA’s percentage-based scaling requires a baseline request value to calculate against.
Can I run Metrics Server without kube-system namespace?
Yes, though the official manifest defaults there. Any namespace works as long as the APIService registration and RBAC bindings are updated to match.
Related posts:
 How to Install Kubernetes (K8s) on Ubuntu 24.04: A Step-by-Step Guide
 KubeSphere and Kubernetes Security: Complete Hardening Guide for 2026
 How to Install Kubernetes Dashboard on Ubuntu 26.04 with Secure Access
 How to Deploy NGINX Ingress Controller on Kubernetes Step-by-Step (2026 Guide)
 Persistent Volumes (PV) and Persistent Volume Claims (PVC) in Kubernetes Explained
 How to Deploy Jenkins on Kubernetes
 Kubernetes Troubleshooting: 50 kubectl Commands Every Administrator Should Know
 Kubernetes Security Best Practices (2026 Edition): The Complete Production Hardening Guide
