How to Install Kubernetes Dashboard on Ubuntu 26.04 with Secure Access

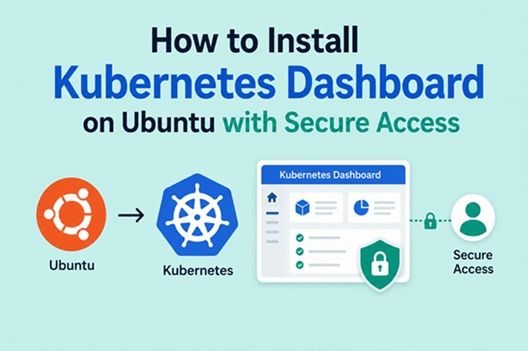
Table of Contents
- What is Kubernetes Dashboard
- The Tesla Lesson: Why Security Comes First
- Prerequisites
- Method 1: Install via Helm (Recommended)
- Method 2: Install via kubectl apply (Quick)
- Create an Admin User and Service Account
- Generate a Long-Lived Access Token
- Access Method 1: kubectl proxy (Local Development)
- Access Method 2: kubectl port-forward (Recommended for Teams)
- Access Method 3: NodePort (Internal Network)
- Access Method 4: Ingress with TLS (Production)
- Create Role-Based Users (Least Privilege)
- Security Hardening Checklist
- Dashboard Overview: Key Features
- Common Issues and Quick Fixes
- Kubernetes Dashboard vs KubeSphere: Which to Use
- Next Steps
Managing a Kubernetes cluster through kubectl commands alone is efficient once you know what you’re doing — but when you need to quickly visualize what’s running, browse logs across multiple pods, or give a team member cluster visibility without a kubectl tutorial, a web UI makes an enormous practical difference. The Kubernetes Dashboard is the official web-based UI maintained by the Kubernetes project itself, and this guide covers the complete installation and — crucially — the security configuration that most tutorials skip.
What is Kubernetes Dashboard
Kubernetes Dashboard is the official web-based UI for managing Kubernetes clusters. It provides a visual interface to deploy applications, troubleshoot workloads, and manage cluster resources without memorizing kubectl commands.
What you can do from the Dashboard:
- View and manage Pods, Deployments, StatefulSets, DaemonSets, Services, Ingresses
- Browse logs from any running container in real time
- Monitor resource usage (CPU and memory) when Metrics Server is installed
- Deploy applications from YAML or via forms
- Inspect events — see why pods are crashing or failing to schedule
- Manage storage — PersistentVolumes, PersistentVolumeClaims, StorageClasses
- View RBAC — roles, role bindings, service accounts
The Dashboard is not installed by default because it requires careful security configuration. An improperly secured Dashboard can expose your entire cluster to attackers.
The Tesla Lesson: Why Security Comes First
In 2018, Tesla’s cloud infrastructure was compromised through an unsecured Kubernetes Dashboard. The attackers gained access to an administrative console that was not password-protected, then used the cluster to mine cryptocurrency — running cryptomining workloads on Tesla’s cloud budget. Do not let that be you.
Most “how to install” guides stop at deployment, leaving the Dashboard in a dangerously exposed state. The Dashboard has full visibility into your cluster and, with the right permissions, can create, modify, and delete any resource.
The three non-negotiables before any team member accesses the Dashboard:
- Strong authentication — token-based or OIDC, never anonymous
- Granular RBAC — least privilege; not everyone needs cluster-admin
- Encrypted transport — HTTPS always, even on internal networks
Prerequisites
Before installing the Dashboard, ensure you have:
- A running Kubernetes cluster — see our Install Kubernetes Cluster on Ubuntu 26.04 guide
kubectlconfigured and connected:kubectl cluster-infoshould succeedhelmv3+ installed (for Method 1)- Metrics Server installed (for resource usage visualization)
Verify cluster access:
kubectl get nodes
# All nodes should show Ready

kubectl cluster-info
# Kubernetes control plane is running at https://...
Method 1: Install via Helm (Recommended)
Helm offers more customization options than the raw manifest and is the recommended approach for production installations.
# Add the Kubernetes Dashboard Helm repository
helm repo add kubernetes-dashboard https://kubernetes.github.io/dashboard/
helm repo update

# Install the Dashboard
helm upgrade --install kubernetes-dashboard \
  kubernetes-dashboard/kubernetes-dashboard \
  --create-namespace \
  --namespace kubernetes-dashboard \
  --set nginx.enabled=false \
  --set cert-manager.enabled=false \
  --set app.ingress.enabled=false
We disable the bundled nginx and cert-manager since most clusters already have these. Enable them if your cluster doesn’t:
# Alternative: enable bundled nginx ingress and cert-manager
helm upgrade --install kubernetes-dashboard \
  kubernetes-dashboard/kubernetes-dashboard \
  --create-namespace \
  --namespace kubernetes-dashboard
Verify installation:
kubectl get pods -n kubernetes-dashboard
# NAME                                         READY   STATUS    RESTARTS
# kubernetes-dashboard-api-xxx                 1/1     Running   0
# kubernetes-dashboard-auth-xxx                1/1     Running   0
# kubernetes-dashboard-kong-xxx                1/1     Running   0
# kubernetes-dashboard-metrics-scraper-xxx     1/1     Running   0
# kubernetes-dashboard-web-xxx                 1/1     Running   0

kubectl get svc -n kubernetes-dashboard
Method 2: Install via kubectl apply (Quick)
For a faster setup without Helm:
kubectl apply -f https://raw.githubusercontent.com/kubernetes/dashboard/v2.7.0/aio/deploy/recommended.yamlVerify:
kubectl get pods -n kubernetes-dashboard
kubectl get svc -n kubernetes-dashboard
# NAME                        TYPE        CLUSTER-IP     PORT(S)
# kubernetes-dashboard        ClusterIP   10.96.x.x      443/TCP
# dashboard-metrics-scraper   ClusterIP   10.96.x.x      8000/TCP
The Dashboard service is ClusterIP by default — only reachable from inside the cluster. Access methods are covered from Step 8 onward.
Create an Admin User and Service Account
The Dashboard needs a token to authenticate. Create service accounts with appropriate permissions.
Create the admin service account and bind it to cluster-admin:
# admin-user.yaml
apiVersion: v1
kind: ServiceAccount
metadata:
  name: admin-user
  namespace: kubernetes-dashboard
---
apiVersion: rbac.authorization.k8s.io/v1
kind: ClusterRoleBinding
metadata:
  name: admin-user
roleRef:
  apiGroup: rbac.authorization.k8s.io
  kind: ClusterRole
  name: cluster-admin
subjects:
  - kind: ServiceAccount
    name: admin-user
    namespace: kubernetes-dashboard
Apply it:
kubectl apply -f admin-user.yamlSecurity note:
cluster-admingrants full control over the entire cluster. Use this only for your personal admin account — for team members, create scoped roles (see Step 12). Never share the admin token.
Generate a Long-Lived Access Token
In Kubernetes 1.24+, service accounts no longer auto-generate permanent tokens. Create one explicitly:
# admin-user-token.yaml
apiVersion: v1
kind: Secret
metadata:
  name: admin-user-token
  namespace: kubernetes-dashboard
  annotations:
    kubernetes.io/service-account.name: "admin-user"
type: kubernetes.io/service-account-token
kubectl apply -f admin-user-token.yamlRetrieve the token:
kubectl get secret admin-user-token \
  -n kubernetes-dashboard \
  -o jsonpath="{.data.token}" | base64 -d
Copy this token — you’ll use it to log into the Dashboard. Store it securely (password manager, not a text file on the desktop).
Alternative: Generate a short-lived token (for temporary access):
# Creates a token valid for 1 hour
kubectl create token admin-user \
  -n kubernetes-dashboard \
  --duration=3600s
Short-lived tokens are preferable when you don’t need persistent Dashboard access — they expire automatically, reducing exposure time if the token is accidentally shared.
Access Method 1: kubectl proxy (Local Development)
The simplest method for local development. Creates a secure tunnel from your machine to the cluster.
kubectl proxy
# Starting to serve on 127.0.0.1:8001
Open in your browser:
http://localhost:8001/api/v1/namespaces/kubernetes-dashboard/services/https:kubernetes-dashboard:/proxy/Pros: No additional setup, uses your kubeconfig authentication
Cons: Only accessible from the machine running the proxy — not suitable for team access or remote servers
Access Method 2: kubectl port-forward (Recommended for Teams)
Port forwarding creates a secure tunnel from your local machine directly to the Dashboard pod.
kubectl port-forward \
  -n kubernetes-dashboard \
  service/kubernetes-dashboard-kong-proxy \
  8443:443
Access at: https://localhost:8443
Your browser will warn about a self-signed certificate — this is expected. Accept the certificate and proceed. You’ll see the Dashboard login screen — paste the token from Step 7.
For Helm installation, find the correct service name:
kubectl get svc -n kubernetes-dashboard
# Find the service that exposes port 443
# Typically: kubernetes-dashboard-kong-proxy

kubectl port-forward \
  -n kubernetes-dashboard \
  service/kubernetes-dashboard-kong-proxy 8443:443
Make port-forward persistent (keep it running in background):
# Run in background with nohup
nohup kubectl port-forward \
  -n kubernetes-dashboard \
  service/kubernetes-dashboard-kong-proxy 8443:443 \
  > /tmp/dashboard-forward.log 2>&1 &

echo "Dashboard available at https://localhost:8443"
Pros: Secure (no ports exposed), works over SSH tunneling, uses cluster authentication
Cons: Requires kubectl access; must be re-run after interruption
Access Method 3: NodePort (Internal Network)
Expose the Dashboard on a fixed port on every cluster node — suitable for access within a trusted internal network:
# Patch the service to NodePort
kubectl patch svc kubernetes-dashboard \
  -n kubernetes-dashboard \
  -p '{"spec": {"type": "NodePort", "ports": [{"port": 443, "targetPort": 8443, "nodePort": 30443}]}}'
Access at: https://<any-node-ip>:30443
For Helm installation, patch the kong-proxy service:
kubectl patch svc kubernetes-dashboard-kong-proxy \
  -n kubernetes-dashboard \
  -p '{"spec": {"type": "NodePort", "ports": [{"port": 443, "targetPort": 8443, "nodePort": 30443}]}}'
Pros: Persistent access, no port-forward session needed
Cons: Exposed on all nodes; requires firewall to restrict access to trusted IPs only
Restrict port 30443 with UFW:
# Allow only from your office/home network
sudo ufw allow from 192.168.1.0/24 to any port 30443 comment "K8s Dashboard internal"
sudo ufw deny 30443
sudo ufw reload
Access Method 4: Ingress with TLS (Production)
For production access, deploy the Dashboard behind an Ingress controller with TLS certificates from cert-manager.
Prerequisites: An Ingress controller (nginx-ingress) and cert-manager installed in the cluster.
# dashboard-ingress.yaml
apiVersion: networking.k8s.io/v1
kind: Ingress
metadata:
  name: kubernetes-dashboard-ingress
  namespace: kubernetes-dashboard
  annotations:
    nginx.ingress.kubernetes.io/backend-protocol: "HTTPS"
    nginx.ingress.kubernetes.io/ssl-passthrough: "true"
    nginx.ingress.kubernetes.io/rewrite-target: /
    # Rate limit to prevent brute force
    nginx.ingress.kubernetes.io/limit-rps: "10"
    # IP allowlist — restrict to your office/VPN IP range
    nginx.ingress.kubernetes.io/whitelist-source-range: "192.168.1.0/24,10.0.0.0/8"
spec:
  ingressClassName: nginx
  tls:
    - hosts:
        - dashboard.yourdomain.com
      secretName: dashboard-tls-cert
  rules:
    - host: dashboard.yourdomain.com
      http:
        paths:
          - path: /
            pathType: Prefix
            backend:
              service:
                name: kubernetes-dashboard-kong-proxy
                port:
                  number: 443
Create a TLS certificate with cert-manager:
# dashboard-certificate.yaml
apiVersion: cert-manager.io/v1
kind: Certificate
metadata:
  name: dashboard-tls
  namespace: kubernetes-dashboard
spec:
  secretName: dashboard-tls-cert
  dnsNames:
    - dashboard.yourdomain.com
  issuerRef:
    name: letsencrypt-prod
    kind: ClusterIssuer
Apply both:
kubectl apply -f dashboard-certificate.yaml
kubectl apply -f dashboard-ingress.yaml
Access at: https://dashboard.yourdomain.com
The nginx.ingress.kubernetes.io/whitelist-source-range annotation is critical — it restricts Dashboard access to specific IP ranges at the ingress level, before a request even reaches the Dashboard pod. Even if someone knows the URL, they can’t reach the login page from an unauthorized IP.
Pros: Real domain, valid SSL certificate, accessible from anywhere on allowlisted IPs
Cons: Most complex setup; requires Ingress controller and cert-manager
Create Role-Based Users (Least Privilege)
Not everyone who needs Dashboard access needs cluster-admin. Create scoped service accounts for team members:
Read-only user for developers:
# readonly-user.yaml
apiVersion: v1
kind: ServiceAccount
metadata:
  name: readonly-user
  namespace: kubernetes-dashboard
---
apiVersion: rbac.authorization.k8s.io/v1
kind: ClusterRole
metadata:
  name: dashboard-readonly
rules:
  - apiGroups: [""]
    resources:
      - pods
      - pods/log
      - services
      - endpoints
      - persistentvolumeclaims
      - configmaps
      - namespaces
      - nodes
      - events
    verbs: ["get", "list", "watch"]
  - apiGroups: ["apps"]
    resources:
      - deployments
      - replicasets
      - statefulsets
      - daemonsets
    verbs: ["get", "list", "watch"]
  - apiGroups: ["batch"]
    resources:
      - jobs
      - cronjobs
    verbs: ["get", "list", "watch"]
---
apiVersion: rbac.authorization.k8s.io/v1
kind: ClusterRoleBinding
metadata:
  name: readonly-user
roleRef:
  apiGroup: rbac.authorization.k8s.io
  kind: ClusterRole
  name: dashboard-readonly
subjects:
  - kind: ServiceAccount
    name: readonly-user
    namespace: kubernetes-dashboard
---
apiVersion: v1
kind: Secret
metadata:
  name: readonly-user-token
  namespace: kubernetes-dashboard
  annotations:
    kubernetes.io/service-account.name: "readonly-user"
type: kubernetes.io/service-account-token
Namespace-scoped user (can manage their own namespace only):
# namespace-user.yaml
apiVersion: v1
kind: ServiceAccount
metadata:
  name: dev-team-user
  namespace: kubernetes-dashboard
---
apiVersion: rbac.authorization.k8s.io/v1
kind: RoleBinding
metadata:
  name: dev-team-binding
  namespace: development    # Scoped to 'development' namespace only
roleRef:
  apiGroup: rbac.authorization.k8s.io
  kind: ClusterRole
  name: edit              # Built-in role: create/edit/delete most resources
subjects:
  - kind: ServiceAccount
    name: dev-team-user
    namespace: kubernetes-dashboard
Generate tokens for each user:
# Read-only user token
kubectl get secret readonly-user-token \
  -n kubernetes-dashboard \
  -o jsonpath="{.data.token}" | base64 -d

# Short-lived token for dev-team-user (expires in 8 hours)
kubectl create token dev-team-user \
  -n kubernetes-dashboard \
  --duration=28800s
Distribute separate tokens to separate team members — this way you can revoke one person’s access without affecting others.
Security Hardening Checklist
The default Dashboard installation is not secure. Configure these controls before granting any team member access.
Authentication:
- [ ] Never use
--enable-skip-loginflag in production — this allows login without a token - [ ] Never use
--insecure-port— Dashboard should always serve over HTTPS - [ ] Use short-lived tokens for temporary access; long-lived tokens only for service accounts
- [ ] Rotate long-lived tokens regularly — delete and recreate the Secret
Authorization:
- [ ] Only one or two people have
cluster-adminbinding - [ ] All other users have scoped roles (read-only or namespace-limited)
- [ ] Review all ClusterRoleBindings:
kubectl get clusterrolebindings -o wide | grep dashboard
Network access:
- [ ] Dashboard never exposed directly to the public internet without IP allowlisting
- [ ] Use port-forward or a VPN for personal access
- [ ] If using NodePort or Ingress, restrict with
ufwornginx whitelist-source-range - [ ] Consider access via SSH tunnel only for maximum security:
ssh -L 8443:localhost:8443 user@k8s-server
Transport:
- [ ] Always HTTPS — never HTTP except through kubectl proxy (which uses the API server’s own TLS)
- [ ] Self-signed certs are acceptable for internal access; use proper certs (cert-manager + Let’s Encrypt) for any browser access without certificate warnings
Monitoring:
- [ ] Enable Kubernetes audit logging to track Dashboard actions
- [ ] Alert on any ClusterRoleBinding creation involving the Dashboard namespace
Dashboard Overview: Key Features
Once logged in with the admin token, the Dashboard shows:
Workloads section:
- Deployments — rollout status, pod counts, restart history
- Pods — live status, node placement, resource usage, log streaming
- StatefulSets, DaemonSets, Jobs, CronJobs — all visible and manageable
Cluster section:
- Nodes — CPU/memory capacity and allocation, conditions
- Namespaces — overview of all namespaces
- Persistent Volumes — storage classes and claim status
Config section:
- ConfigMaps and Secrets — view (not decode) secret names and metadata
- Resource Quotas and Limit Ranges — per-namespace resource constraints
Quick actions directly from the UI:
- Scale a Deployment (change replica count)
- Roll back a Deployment to a previous revision
- Delete a stuck Pod (to trigger rescheduling)
- Exec into a running container (terminal in browser)
- View real-time logs across multiple containers
The resource usage graphs — showing CPU and memory per pod and node — only populate when the Metrics Server is installed. See our Kubernetes cluster guide for Metrics Server installation steps.
Common Issues and Quick Fixes
| Symptom | Likely Cause | Fix |
|---|---|---|
| Dashboard login page shows but token rejected | Token from wrong service account, or expired | Regenerate token: kubectl create token admin-user -n kubernetes-dashboard |
| Dashboard pods not starting | Insufficient resources on nodes | Check kubectl describe pod -n kubernetes-dashboard; verify node has capacity |
kubectl proxy works but browser shows “not found” | Wrong URL path | Use exact URL: .../services/https:kubernetes-dashboard:/proxy/ (note https:) |
| Port-forward disconnects frequently | Network timeout or idle connection | Use --pod-running-timeout=5m flag; restart port-forward |
| Self-signed cert warning in browser | Dashboard uses self-signed cert by default | Accept the warning for internal use; use cert-manager + Let’s Encrypt for production |
| Metrics not showing (CPU/memory) | Metrics Server not installed | Install Metrics Server (see kubeadm install guide) |
| NodePort not accessible | Firewall blocking port 30443 | Check UFW: sudo ufw status; add allow rule for your IP |
| Dashboard shows “Unauthorized” after login | Token lacks required RBAC permissions | Verify ClusterRoleBinding is created correctly |
Kubernetes Dashboard vs KubeSphere: Which to Use
| Kubernetes Dashboard | KubeSphere | |
|---|---|---|
| Installation | Simple (single kubectl apply or Helm) | Complex (runs on top of K8s) |
| Resource usage | Minimal (~100MB RAM) | Heavy (~4GB RAM minimum) |
| Multi-tenancy | ❌ No | ✅ Yes (workspace isolation) |
| CI/CD built-in | ❌ No | ✅ Yes (Jenkins-based) |
| Monitoring built-in | Basic (needs Metrics Server) | ✅ Full (Prometheus-based) |
| Log viewing | ✅ Per-pod log streaming | ✅ Centralized logs |
| App marketplace | ❌ No | ✅ Yes |
| Learning curve | Low | Medium |
| Best for | Quick cluster visibility, individuals | Enterprise multi-team environments |
Use Kubernetes Dashboard when: you want quick visibility into a cluster without adding heavyweight dependencies, or for personal/single-team use.
Use KubeSphere when: you have multiple teams sharing a cluster and need workspace isolation, built-in CI/CD, and enterprise-grade observability. See our KubeSphere and Kubernetes Security guide for the full setup.
Next Steps
With the Kubernetes Dashboard running securely:
- Harden your cluster — the Dashboard gives you visibility, but the underlying Kubernetes security still needs attention. Our KubeSphere and Kubernetes Security Hardening guide covers RBAC, Pod Security Standards, network policies, and secret encryption.
- Add monitoring — install the Prometheus + Grafana monitoring stack alongside the Dashboard for metric-based alerting that the Dashboard alone doesn’t provide.
- Centralize logs — the Dashboard streams individual pod logs, but for searching across all pods or setting log-based alerts, add Grafana Loki to your cluster.
- Consider KubeSphere — if your team has grown to the point where per-user RBAC management in the Dashboard feels like overhead, KubeSphere’s workspace model handles multi-team access natively with a richer UI.
Related posts:
 How to Install Kubernetes Cluster on Ubuntu 26.04 LTS Using kubeadm (2026 Guide)
 How to Install Helm on Ubuntu 26.04 LTS (Complete Guide 2026)
 Install and Configure K3s with NVIDIA GPU Operator on Ubuntu 22.04
 KubeSphere and Kubernetes Security: Complete Hardening Guide for 2026
 How to Install MetalLB on Bare Metal Kubernetes Cluster (L2 and BGP Guide)
 How to Back Up and Restore Kubernetes Cluster Using Velero (2026 Guide)
 How to Install Podman on Ubuntu 26.04 LTS (2026)
 How To Install Docker On Ubuntu 22.04
