Zabbix vs Nagios vs HertzBeat (2026): Which Monitoring Tool Should You Choose?

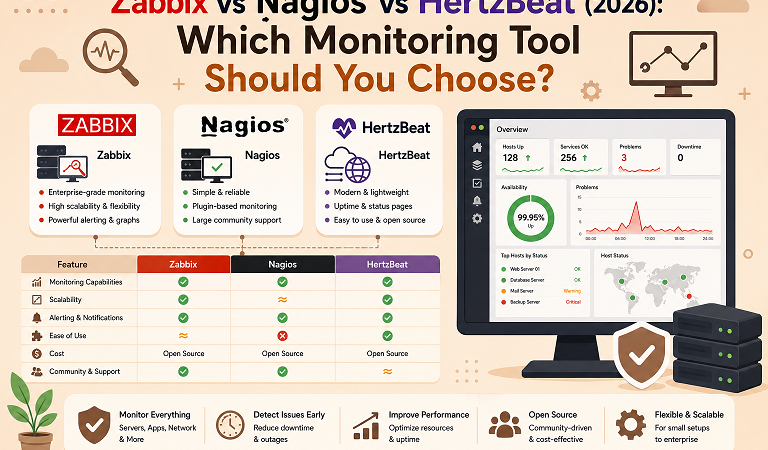
Zabbix, Nagios Core, and Apache HertzBeat all answer the same question: “Is my infrastructure healthy, and who gets told when it is not?” They answer it in very different ways. Nagios Core is a veteran check scheduler driven by text configuration files. Zabbix is a full monitoring platform with a database, templates, auto-discovery, and a rich web UI. HertzBeat is a newer, agentless Apache project that tries to put metrics, alerting, and a modern UI in one easy-to-start package.
This comparison covers the facts as of late 2026, shows how each tool is built, and ends with a decision guide for homelabs, small businesses, enterprises, and cloud-native teams.
Table of Contents
- Quick verdict
- Where each project stands in 2026
- Architecture compared
- Feature comparison table
- Data collection: agents, agentless and protocols
- Alerting and notifications
- Scaling, high availability and storage
- Resource needs and learning curve
- Getting started with each tool
- Decision guide
- What about Prometheus?
- Migration notes
- FAQ
1. Quick verdict
| If you want… | Choose |
|---|---|
| A complete, scalable monitoring platform with templates, discovery, and an LTS version | Zabbix |
| Simple up/down checks, a huge plugin ecosystem, and you are comfortable with config files | Nagios Core |
| Fast setup, agentless collection, a modern UI, and a lightweight start | HertzBeat |
| Metrics for Kubernetes and microservices at scale | Consider Prometheus (see section 11) |
If you only read one line: Zabbix is the best all-rounder, Nagios Core is the minimalist veteran, and HertzBeat is the easiest to try.
2. Where each project stands in 2026
| Zabbix | Nagios Core | Apache HertzBeat | |
|---|---|---|---|
| First released | 2004 (stable 1.0) | 1999 (as NetSaint) | Open source project, now Apache Software Foundation |
| Current stable line | 7.0 LTS (7.0.x), 7.4 (standard) | 4.5.x (4.5.14 released August 2026) | 1.8.0 (released February 2026) |
| Next major | 8.0 LTS, release candidates in October 2026, GA planned Q4 2026 | 4.5.x maintenance | Releases roughly every 2 to 3 months |
| License | AGPLv3 (since 7.0) | GPL | Apache License 2.0 |
| Support policy | LTS: 5 years (3 full + 2 limited). 7.0 LTS: full support to 30 June 2027, limited to 30 June 2029 | Community; commercial editions from Nagios Enterprises | Community; Apache governance |
Zabbix LTS vs standard releases. Zabbix publishes LTS versions (X.0) with five years of coverage and standard versions (X.2, X.4) with roughly a year. For production, pick an LTS line. 7.0 LTS is the current choice until 8.0 LTS reaches general availability; plan your 7.0 to 8.0 upgrade after the first patch releases of 8.0.
3. Architecture compared
 ZABBIX                          NAGIOS CORE                        HERTZBEAT
 ------                          -----------                        ---------
 +-------------------+           +--------------------+             +--------------------+
 | Web UI (PHP)      |           | Web UI (CGI)       |             | Web UI + API       |
 +---------+---------+           +---------+----------+             +---------+----------+
           |                               |                                  |
 +---------v---------+           +---------v----------+             +---------v----------+
 | Zabbix server     |           | Nagios Core daemon |             | HertzBeat server   |
 | (polling, triggers|           | (check scheduler)  |             | (manager +         |
 |  alerts, HA)      |           |                    |             |  alert engine)     |
 +----+---------+----+           +----+----------+----+             +----+---------+-----+
      |         |                     |          |                       |         |
 +----v---+ +---v--------+      +-----v---+ +----v------+          +-----v----+ +--v-----------+
 | SQL DB | | Proxy      |      | Plugins | | NRPE /    |          | Metadata | | Collector(s) |
 | (MySQL/| | (remote    |      | (checks)| | NSClient++|          | DB       | | (agentless)  |
 | Maria/ | |  sites)    |      +---------+ +-----------+          +----------+ +------+-------+
 | PgSQL) | +---+--------+                                                              |
 +--------+     |                                                          SSH / HTTP / JDBC /
         Zabbix agent / agent 2 / SNMP / IPMI / JMX / HTTP                  SNMP / protocols
Key differences:
- Zabbix keeps configuration and history in a relational database. Proxies collect data at remote sites and forward it to the server.
- Nagios Core is a scheduler that runs plugin executables and records state in files; history and graphs usually need add-ons.
- HertzBeat uses a manager plus lightweight collectors that reach targets with protocols such as HTTP, SSH, JDBC, and SNMP, so you often do not install anything on monitored hosts.
4. Feature comparison table
| Feature | Zabbix | Nagios Core | HertzBeat |
|---|---|---|---|
| Built-in dashboards and graphs | Yes, extensive | Basic status pages; graphs via add-ons | Yes, modern UI |
| Templates and auto-discovery | Yes, very strong (LLD, network discovery) | Manual, or via config tools | Template-based monitor definitions |
| Agent | Zabbix agent / agent 2 | NRPE, NSClient++, plugins | Agentless by design |
| SNMP, IPMI, JMX, HTTP checks | Yes | Via plugins | SNMP, JMX, HTTP and many more protocol types |
| Web/synthetic monitoring | Yes (including browser monitoring in 7.0) | Via plugins | HTTP and API checks |
| Kubernetes monitoring | Yes, templates | Via plugins | Via supported integrations |
| Alerting channels | Email, webhooks, chat, many media types | Email and scripts, extend with plugins | Email, webhook and common chat platforms |
| Escalations and maintenance windows | Yes | Basic (downtime scheduling) | Alert grouping and silences |
| Multi-user, roles and MFA | Yes (MFA added in 7.0) | Basic users | Yes |
| API | Full JSON-RPC API | Limited | REST API |
| Distributed monitoring | Proxies, proxy groups | Possible with extra design | Multiple collectors |
| Built-in HA for the server | Yes (since 6.0) | Not built in | Cluster options via collectors; see docs |
| Log monitoring | Yes (log items) | Via plugins | Growing support |
| Cost | Free; paid support available | Free core; commercial editions exist | Free |
5. Data collection: agents, agentless and protocols
| Zabbix | Nagios Core | HertzBeat | |
|---|---|---|---|
| Primary model | Passive and active agent checks, plus agentless | Server runs plugins locally or through NRPE | Agentless collectors |
| Install on every host? | Usually yes (agent 2), but not required for SNMP, ICMP, HTTP | Often yes (NRPE) | Usually no |
| Network devices | SNMP traps and polling, templates for many vendors | check_snmp and plugins | SNMP monitors |
| Databases and middleware | Templates for MySQL, PostgreSQL, Redis, and more | Plugins | Built-in monitor types for many databases and services |
| Custom checks | UserParameters, scripts, external checks | Any executable following the plugin API | Custom monitor templates |
If you cannot or will not install software on monitored systems, HertzBeat or SNMP/ICMP/HTTP checks in Zabbix are a good fit. If you need deep OS-level metrics and process-level detail, an agent (Zabbix agent 2, or Prometheus node exporter) is better.
6. Alerting and notifications
| Zabbix | Nagios Core | HertzBeat | |
|---|---|---|---|
| Trigger logic | Expressions with functions, dependencies, and recovery conditions | Hard/soft states, retry counts | Threshold rules with periods |
| Noise control | Dependencies, event correlation, maintenance, escalation | Host/service dependencies, downtime | Grouping, silence rules |
| Channels | Rich media type system | Email and custom commands | Common notification integrations |
Zabbix and Nagios both have mature alert logic. HertzBeat’s rules are simpler to set up, which is a benefit for small teams and a limit for complex dependency trees.
7. Scaling, high availability and storage
| Zabbix | Nagios Core | HertzBeat | |
|---|---|---|---|
| Sizing | Thousands of hosts with a tuned database and proxies | Hundreds to a few thousand checks per instance, then split instances | Small to medium deployments; scale with collectors |
| Database | MySQL / MariaDB / PostgreSQL (TimescaleDB supported) | None required for core; state in files | Metadata DB plus optional time-series store; see the project docs for supported options |
| Long-term history | Yes, with housekeeping and partitioning | Needs add-ons | Depends on configured storage |
| Server HA | Native HA cluster | External clustering | Check current docs |
Zabbix’s database is its strength and its main tuning task. Plan disk I/O and partitioning from the start for large installations.
8. Resource needs and learning curve
| Zabbix | Nagios Core | HertzBeat | |
|---|---|---|---|
| Minimum to start | Small VM with a database (2 vCPU / 2-4 GB for a lab) | Very small (1 vCPU / 1 GB for a lab) | The project’s docs list 2 CPU cores and 4 GB RAM as a minimum |
| Setup time | Medium: server, DB, frontend, agents | Medium: compile or package, web server, config files | Low: one Docker command |
| Day-2 effort | Templates and tuning | Config file management, plugin upkeep | Low to medium |
| Learning curve | Moderate | Steep for configuration, simple concepts | Gentle |
9. Getting started with each tool
HertzBeat (fastest):
docker run -d -p 1157:1157 -p 1158:1158 --name hertzbeat apache/hertzbeat
# Web UI: http://<host>:1157
# The documented default login is admin / hertzbeat, so change it immediately.
For production, pin the image tag, persist data volumes, and place the UI behind HTTPS.
Nagios Core: compile or install from packages, then configure hosts and services in text files. We have a full walkthrough in our Nagios Core on Ubuntu 26.04 LTS guide.
Zabbix (7.0 LTS): add the official Zabbix repository for your distribution, install the server, frontend, and agent 2 packages, create the database, import the schema, and start the services. Use the repository instructions on zabbix.com for your exact OS and database; they change per release. On Rocky Linux 10, plan for the CRB and EPEL repositories where dependencies require them.
If you also want logs, pair any of these tools with Loki; see Loki + Grafana Log Aggregation Setup.
10. Decision guide
| Scenario | Best fit | Why |
|---|---|---|
| Homelab, a few servers | HertzBeat or Zabbix | HertzBeat starts in minutes; Zabbix teaches skills that transfer to jobs |
| Small business, 20-200 devices | Zabbix | Templates, SNMP discovery, and one UI for servers and network gear |
| Large enterprise, thousands of hosts | Zabbix (with proxies and HA) | Proven at scale, LTS lifecycle, commercial support |
| Existing Nagios plugins and workflows | Nagios Core | Keep what works; consider Zabbix when scaling pain appears |
| No agent installs allowed | HertzBeat or Zabbix SNMP/ICMP | Agentless collection |
| Compliance reporting and long history | Zabbix | Database-backed history and reporting |
| Kubernetes and cloud-native | Prometheus + Grafana, or Zabbix K8s templates | Pull-based metrics, service discovery |
| Team new to monitoring | HertzBeat first, then Zabbix | Gentle learning curve |
Scoring summary (1 = weak, 5 = strong, based on the criteria above):
| Criterion | Zabbix | Nagios Core | HertzBeat |
|---|---|---|---|
| Ease of setup | 3 | 2 | 5 |
| Scalability | 5 | 3 | 3 |
| Out-of-the-box dashboards | 5 | 2 | 4 |
| Flexibility of checks | 5 | 5 | 3 |
| Long-term history | 5 | 2 | 3 |
| Community and ecosystem maturity | 5 | 5 | 3 |
These scores are the author’s judgment for typical use, not benchmark results.
11. What about Prometheus?
Prometheus is a different model: it pulls time-series metrics and uses PromQL for alert rules and queries. It excels at dynamic environments such as Kubernetes. It is weaker at classic “is this device up” checks on static network gear, where Zabbix and Nagios shine. Many teams run Zabbix for infrastructure and network devices and Prometheus for container workloads. See Prometheus Alertmanager: Alert Rules, Routing & Slack Notifications, Prometheus and Grafana on Rocky Linux 10, and OpenTelemetry on Kubernetes.
12. Migration notes
| From | To | Advice |
|---|---|---|
| Nagios | Zabbix | Rebuild hosts from templates rather than converting configs 1:1; reuse your plugin scripts as external checks or UserParameters; run both in parallel for a few weeks |
| Nagios or Zabbix | HertzBeat | Recreate monitors by type; start with the most critical services; keep the old system until alerts are verified |
| Zabbix 7.0 | Zabbix 8.0 | Wait for GA plus the first patches; read the upgrade notes (frontend PHP and database minimum versions rise); test the schema upgrade on a copy first |
Whatever you choose, document your alert thresholds and escalation paths before migrating. Tools change; runbooks last.
13. FAQ
Is Zabbix better than Nagios?
For most new deployments, yes: it includes dashboards, discovery, templates, and history. Nagios Core remains solid for straightforward check-based monitoring and for teams with a large investment in plugins.
Is HertzBeat production-ready?
It is an active Apache project with regular releases and works well for small and medium environments. Evaluate its alerting depth and storage options against your needs, and test at your expected scale.
Which one is easiest for a homelab?
HertzBeat for the quickest start. Zabbix if you want the skill set that employers recognize.
Are they free?
Yes. Zabbix (AGPLv3), Nagios Core (GPL), and HertzBeat (Apache 2.0) are free. Paid support or commercial editions exist for Zabbix and Nagios.
Can they monitor Docker and Kubernetes?
Zabbix has container and Kubernetes templates, Nagios relies on plugins, and HertzBeat supports many integrations. For container-heavy platforms, Prometheus is often a better primary tool.
Which Zabbix version should I install today?
Use 7.0 LTS for production now, and plan the move to 8.0 LTS after it reaches general availability and receives its first patch releases.
Related posts:
 How to install Prometheus on Centos 8
 How To Install Grafana on Ubuntu 20.04 LTS
 How To Install Prometheus on Debian 11
 Installing and Setting Up Nagios on CentOS Stream 9: A Practical Guide
 How to Install Monitorix on CentOS Stream 10 (Step-by-Step Guide)
 Datadog: The Complete Guide to Modern Monitoring and Observability (2025 Edition)
 Grafana Loki with Docker Compose: Centralized Log Aggregation Guide (2026)
 How to Install Elasticsearch on Ubuntu 26.04 LTS
