How to Install Apache HertzBeat on Ubuntu 26.04 LTS

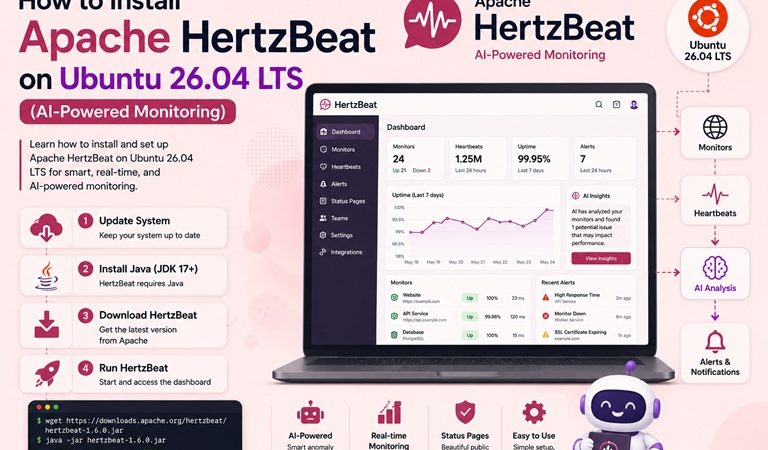
Table of Contents
- What is Apache HertzBeat
- Why HertzBeat in 2026: The Agentless Advantage
- HertzBeat vs Prometheus + Grafana: When to Use Which
- Prerequisites
- Method 1: Install with Docker (Quickest)
- Method 2: Install with Docker Compose (Recommended for Production)
- First Login and Dashboard Overview
- Add Your First Monitor: Linux Host via SSH
- Monitor a Docker Container
- Monitor Redis and MongoDB
- Configure Alert Thresholds
- Set Up Alert Notifications (Slack, Email, Webhook)
- Build a Status Page
- Secure HertzBeat: Change Default Credentials
- Common Issues and Quick Fixes
- Next Steps
Most monitoring stacks are built from separate tools: Prometheus scrapes metrics, Grafana visualizes them, Alertmanager sends notifications, and a separate log collector handles logs. Each component needs installation, configuration, and ongoing maintenance. Apache HertzBeat takes a different approach — it’s a single platform that combines metrics collection, visualization, alerting, and notification into one deployable unit, with no agent required on the monitored systems.
Accepted as an Apache Top-Level Project in 2024 and now on version 1.8.0 (May 2026), HertzBeat is one of the fastest-growing open-source observability tools in the ecosystem — and still has relatively sparse English documentation compared to tools like Prometheus, which makes this guide particularly useful for teams evaluating it.
What is Apache HertzBeat
Apache HertzBeat is an AI-powered next-generation open source real-time observability system. It combines metrics collection, log collection, alerting, and notification into a single platform, and uses an agentless architecture — connecting directly to monitored systems over their native protocols (SSH, JDBC, HTTP, JMX, SNMP, Prometheus) without deploying any agent or exporter on the target host.
What makes it distinctive:
- All-in-one: HertzBeat includes data collection, data storage, visualization, alerting, and a web interface in a single package — in stark contrast to more modular approaches like the Prometheus + Grafana stack.
- Agentless: No exporters, no sidecars, no per-host agents to deploy, version-match, or upgrade.
- AI-powered: HertzBeat AI provides anomaly detection and intelligent alert correlation — reducing alert noise without manual threshold tuning.
- Prometheus-compatible: If you already have Prometheus exporters running, HertzBeat can scrape them directly.
- Built-in status pages: Public-facing status pages for your services, built in — no separate tool needed.
Why HertzBeat in 2026: The Agentless Advantage
The most troublesome thing in monitoring is the installation, deployment, debugging, and upgrading of various agents. You need to install one agent per host, and several corresponding agents to monitor different application middleware, and the number of monitoring targets can easily reach thousands.
HertzBeat eliminates this by connecting to each target system using its native protocol:
| What you’re monitoring | Protocol HertzBeat uses |
|---|---|
| Linux/Ubuntu host | SSH |
| MySQL / PostgreSQL | JDBC |
| Redis | Redis protocol |
| MongoDB | MongoDB protocol |
| JVM (Tomcat, Kafka) | JMX |
| Docker containers | Docker API |
| HTTP endpoints | HTTP/HTTPS |
| Network devices | SNMP |
| Custom metrics | Prometheus scrape or HTTP API |
The result: adding a new monitoring target is a form in the web UI, not a deployment task.
HertzBeat vs Prometheus + Grafana: When to Use Which
| Apache HertzBeat | Prometheus + Grafana | |
|---|---|---|
| Architecture | All-in-one, agentless | Modular — separate scraper, TSDB, visualizer |
| Agent required | ❌ No | ✅ Yes (exporters per service) |
| Setup complexity | Low (one Docker container) | Higher (3+ components) |
| AI-powered alerting | ✅ Built-in | ❌ Not built-in |
| Custom dashboards | Good (built-in) | Excellent (Grafana is class-leading) |
| Ecosystem/plugins | Growing | Massive |
| Status pages | ✅ Built-in | ❌ Needs separate tool |
| PromQL support | Compatible (can scrape Prometheus exporters) | Native |
| Best for | Teams wanting low-ops monitoring with broad coverage | Teams needing deep customization and massive ecosystem |
Use HertzBeat when: you want broad monitoring coverage (servers, databases, middleware, containers) with minimal operational overhead — one tool, no agents, working in 30 minutes.
Use Prometheus + Grafana when: you need advanced dashboard customization, complex PromQL queries, or you’re already deeply invested in the Prometheus ecosystem. Our Prometheus + Grafana monitoring stack guide covers that setup in full.
Both together: HertzBeat is Prometheus-compatible — you can point it at existing Prometheus endpoints. Some teams run both: Prometheus + Grafana for deep infrastructure metrics, HertzBeat for agentless application and database monitoring with built-in alerting.
Prerequisites
- Ubuntu 26.04 LTS (Resolute Raccoon)
- Docker and Docker Compose installed — see our Install Docker on Ubuntu 26.04 LTS guide
- Minimum 2GB RAM (4GB+ recommended for production)
- Port 1157 (Web UI) and 1158 (Management API) available
Method 1: Install with Docker (Quickest)
The fastest way to get HertzBeat running — ideal for evaluation:
docker run -d \
  --name hertzbeat \
  --restart always \
  -p 1157:1157 \
  -p 1158:1158 \
  -v /opt/hertzbeat/data:/opt/hertzbeat/data \
  -v /opt/hertzbeat/logs:/opt/hertzbeat/logs \
  apache/hertzbeat:latest
Access the web UI at http://<your-server-ip>:1157 within 30-60 seconds.
Default credentials:
- admin / hertzbeat
- tom / hertzbeat (user role)
- guest / hertzbeat (read-only)
Change default credentials immediately before exposing HertzBeat to any network — see the security section below.
Method 2: Install with Docker Compose (Recommended for Production)
For production deployments, use Docker Compose with PostgreSQL as the metadata database and VictoriaMetrics as the time-series storage backend — both more durable than the default embedded H2 database:
Create the project structure:
mkdir -p ~/hertzbeat-stack && cd ~/hertzbeat-stack
mkdir -p data/hertzbeat data/postgresql data/victoria-metrics logs
.env file:
HERTZBEAT_VERSION=1.8.0
POSTGRES_PASSWORD=change_this_strong_password
POSTGRES_DB=hertzbeat
TZ=Asia/Jakartacompose.yml:
version: '3.8'

networks:
  hertzbeat-net:
    driver: bridge

volumes:
  hertzbeat-data:
  postgresql-data:
  victoria-metrics-data:

services:
  postgresql:
    image: postgres:15-alpine
    container_name: hertzbeat-postgresql
    restart: unless-stopped
    environment:
      POSTGRES_DB: ${POSTGRES_DB}
      POSTGRES_USER: hertzbeat
      POSTGRES_PASSWORD: ${POSTGRES_PASSWORD}
      TZ: ${TZ}
    volumes:
      - postgresql-data:/var/lib/postgresql/data
    networks:
      - hertzbeat-net
    healthcheck:
      test: ["CMD", "pg_isready", "-U", "hertzbeat"]
      interval: 10s
      retries: 5

  victoria-metrics:
    image: victoriametrics/victoria-metrics:latest
    container_name: hertzbeat-victoria-metrics
    restart: unless-stopped
    command:
      - '--storageDataPath=/victoria-metrics-data'
      - '--retentionPeriod=3'  # 3 months retention
      - '--httpListenAddr=:8428'
    volumes:
      - victoria-metrics-data:/victoria-metrics-data
    networks:
      - hertzbeat-net

  hertzbeat:
    image: apache/hertzbeat:${HERTZBEAT_VERSION}
    container_name: hertzbeat
    restart: unless-stopped
    environment:
      TZ: ${TZ}
      SPRING_DATASOURCE_URL: jdbc:postgresql://postgresql:5432/${POSTGRES_DB}
      SPRING_DATASOURCE_USERNAME: hertzbeat
      SPRING_DATASOURCE_PASSWORD: ${POSTGRES_PASSWORD}
      WAREHOUSE_STORE_JPA_ENABLED: 'false'
      WAREHOUSE_STORE_VICTORIA_METRICS_ENABLED: 'true'
      WAREHOUSE_STORE_VICTORIA_METRICS_URL: http://victoria-metrics:8428
    ports:
      - "1157:1157"
      - "1158:1158"
    volumes:
      - hertzbeat-data:/opt/hertzbeat/data
      - ./logs:/opt/hertzbeat/logs
    depends_on:
      postgresql:
        condition: service_healthy
    networks:
      - hertzbeat-net
    healthcheck:
      test: ["CMD", "curl", "-f", "http://localhost:1157"]
      interval: 30s
      timeout: 10s
      retries: 5
      start_period: 60s
Start the stack:
docker compose up -d
docker compose logs -f hertzbeat
Wait for: Started HertzBeatMainApp in ... seconds in the logs — typically 45-60 seconds on first boot while it initializes the PostgreSQL schema.
First Login and Dashboard Overview
Open http://<your-server-ip>:1157 and log in with admin / hertzbeat.
The dashboard shows:
- Monitor Overview — total monitors, healthy vs alerting counts
- Alert Overview — recent alerts by severity
- Service availability timeline — at-a-glance up/down status for all monitored services
Navigation on the left:
| Menu | Purpose |
|---|---|
| Monitoring | Add and manage monitors by category |
| Alert | Alert thresholds, alert center, silences |
| Notification | Notification channels (Slack, email, webhook) |
| Status Page | Public-facing service status pages |
| Settings | Users, collectors, labels, monitoring templates |
Add Your First Monitor: Linux Host via SSH
HertzBeat monitors Linux hosts directly over SSH — no agent installation required:
- Go to Monitoring → Operating System → Linux
- Click + Add Monitor
- Fill in the form:
- Monitor Name: your server’s hostname or label
- Host: IP address of the server to monitor
- Port: 22 (SSH)
- Username: a user with read access (create a dedicated monitoring user for best practice)
- Password: or paste an SSH private key
- Collection Interval: 60s (default — lower for more granular data at the cost of more SSH connections)
- Click Test Connection — HertzBeat connects over SSH and reports back immediately if the credentials work
- Click OK to save
Within one collection interval, you’ll see real-time metrics for:
- CPU usage (per core and aggregate)
- Memory usage and swap
- Disk I/O and filesystem usage per mount point
- Network bytes in/out per interface
- Load average (1m, 5m, 15m)
- Running process count
No exporter. No agent. Just SSH.
Monitor a Docker Container
HertzBeat connects to the Docker daemon API to monitor containers:
- Monitoring → Cloud Native → Docker
- Click + Add Monitor
- Configure:
- Host: the Docker host IP
- Port: 2375 (Docker daemon TCP port — see note below)
- Collection Interval: 30s
Docker daemon TCP access: By default, Docker only listens on a Unix socket (
/var/run/docker.sock), not a TCP port. To enable TCP access from HertzBeat:sudo nano /etc/docker/daemon.json{ "hosts": ["unix:///var/run/docker.sock", "tcp://127.0.0.1:2375"] }sudo systemctl restart dockerBind only to
127.0.0.1:2375, not0.0.0.0:2375— never expose the Docker daemon TCP port to the network without TLS authentication. If HertzBeat is on the same host,127.0.0.1is sufficient. See our Docker Container Security Best Practices guide for the full context on Docker daemon security.
Monitor Redis and MongoDB
Both integrate without any exporter — HertzBeat speaks the native protocol directly.
Redis monitoring:
- Monitoring → Cache → Redis
- Fill in Host, Port (6379), Password (if set), DB index
- Click Test Connection → OK
Metrics collected: memory usage, hit/miss ratio, connected clients, keyspace info, replication lag, command statistics.
This pairs directly with our Redis with Docker Compose guide — once Redis is running in Docker, add it to HertzBeat monitoring to get real-time visibility into maxmemory usage and eviction rates without any additional configuration on the Redis side.
MongoDB monitoring:
- Monitoring → Database → MongoDB
- Fill in Host, Port (27017), Username, Password, Auth DB
- Click Test Connection → OK
Metrics collected: connections, operations per second, replica set status, memory usage, document counts per collection, index usage.
For a replica set setup compatible with HertzBeat monitoring, see our MongoDB with Docker Compose guide.
Configure Alert Thresholds
HertzBeat supports two types of thresholds:
Real-time thresholds — evaluated immediately when each metric is collected:
- Go to Alert → Threshold → Add Threshold
- Select the monitor type (e.g., Linux)
- Select the metric (e.g.,
cpu → usage) - Set the condition:
usage > 85 - Set severity:
WarningorCritical - Set trigger times:
3(fires after 3 consecutive violations — prevents flapping alerts) - Click OK
Scheduled thresholds — evaluated periodically, useful for aggregations:
Used for metrics like “average CPU over the last hour > 70%” where continuous evaluation is expensive. Configure under Alert → Scheduled Threshold.
Example thresholds to configure immediately:
| Monitor | Metric | Condition | Severity |
|---|---|---|---|
| Linux | cpu.usage | > 85 | Warning |
| Linux | memory.used_percent | > 90 | Warning |
| Linux | disk.used_percent | > 85 | Warning |
| Redis | memory.used_percent | > 80 | Warning |
| Any | availability | == 0 | Critical |
Set Up Alert Notifications (Slack, Email, Webhook)
- Go to Notification → Notification Channel → Add Channel
- Select channel type:
Slack:
- Name:
Slack Alerts - Webhook URL: your Slack incoming webhook URL
- Channel:
#alerts
Email:
- Configure SMTP settings (host, port, sender credentials)
- Add recipient email addresses
Generic Webhook (for integration with any system):
- POST URL: your webhook endpoint
- HertzBeat sends alert payload as JSON — useful for custom integrations with ticketing systems, PagerDuty, or home-built notification pipelines
- After saving the channel, go to Notification → Notification Policy → Add Policy
- Link your threshold rules to the notification channel — this is the bridge between “alert fired” and “notification sent”
Build a Status Page
One of HertzBeat’s most useful features that competitors don’t include out of the box:
- Go to Status Page → Add Status Page
- Configure:
- Page Name: “bckinfo.com Service Status”
- Description: real-time status for your services
- Monitors to show: select which monitors appear on the page
- Save — HertzBeat generates a public URL
The status page shows real-time up/down status, uptime percentages, and incident history for each selected service. Share the URL with users or stakeholders who need visibility into service health without access to the full monitoring dashboard.
Secure HertzBeat: Change Default Credentials
This step is mandatory before exposing HertzBeat to any network — the default admin/hertzbeat credentials are publicly documented.
Method 1: Via the Web UI
- Login as admin → top-right avatar → Account Settings
- Change password for the
adminaccount - Repeat for any other default accounts (
tom,guest) or delete them if unused
Method 2: Via sureness.yml (for Docker deployments)
Create a custom sureness.yml with hashed passwords:
# /opt/hertzbeat/sureness.yml
account:
  - appId: admin
    credential: your_hashed_password_here
    role: [admin]
  - appId: your_username
    credential: another_hashed_password
    role: [user]
Mount it into the container by adding to compose.yml:
services:
  hertzbeat:
    volumes:
      - ./sureness.yml:/opt/hertzbeat/config/sureness.yml:ro
Restart HertzBeat to apply:
docker compose restart hertzbeatAdditional hardening:
- Put HertzBeat behind Nginx Proxy Manager with HTTPS and an Access Control List — restrict port 1157 to your IP, not the open internet
- Bind port 1157 to
127.0.0.1incompose.ymlif using a reverse proxy:"127.0.0.1:1157:1157"
Common Issues and Quick Fixes
| Symptom | Likely Cause | Fix |
|---|---|---|
| Web UI not loading after startup | HertzBeat still initializing | Wait 60-90 seconds on first boot (PostgreSQL schema setup takes time) |
SSH monitor fails — Connection refused | Firewall blocking port 22 from the HertzBeat host | Allow SSH from the HertzBeat container’s IP, or run HertzBeat on the same network |
Docker monitor fails — Connection refused | Docker daemon not listening on TCP | Enable TCP in /etc/docker/daemon.json, bind to 127.0.0.1:2375 |
Redis monitor fails — WRONGPASS | Wrong password configured | Verify password matches requirepass in redis.conf |
| Alerts fire but no notification sent | Notification policy not linked to threshold | Create a Notification Policy connecting the threshold to the channel |
| High memory usage on HertzBeat container | Too many monitors with short intervals | Increase collection intervals for non-critical monitors; add resource limits in compose.yml |
| Data lost after container restart | Using default H2 embedded database | Use the Docker Compose setup with PostgreSQL and VictoriaMetrics |
Next Steps
With HertzBeat running on Ubuntu 26.04, you have a complete observability platform covering the services in your stack:
- Add Tomcat JVM monitoring — connect to your Apache Tomcat 11 instance via JMX for heap usage, thread pool, and request throughput metrics without touching
jmx_exporter - Add Kafka monitoring — monitor your Apache Kafka broker via JMX: consumer group lag, partition leader status, and message throughput
- Enable Prometheus compatibility — if you already run a Prometheus + Grafana stack, configure HertzBeat to scrape your existing Prometheus exporters so both systems share the same data
- Set up the status page — make your service status publicly accessible in one click, something the Prometheus + Grafana stack requires a separate tool to achieve
Related posts:
 How to Install Apache Maven on Ubuntu 26.04 LTS (Step-by-Step Guide)
 How To Install Apache Web Server on Ubuntu 18.04 LTS
 Installing Apache Groovy On Ubuntu 20.04 LTS Step by Step
 How To Install Apache ANT on Ubuntu 20.04 LTS
 Guide to Installing Apache Flink on Ubuntu 20.04
 How To Uninstall Apache Web Server from Ubuntu 22.04 (A Step-by-Step Guide)
 How To Install Apache Solr 8.9 On Ubuntu 20.04 LTS Step by Step
 How to Install Apache Atlas on Ubuntu 24.04 LTS — A Complete Guide
